
The fragmented cost of energy - IntelliNews Lambda


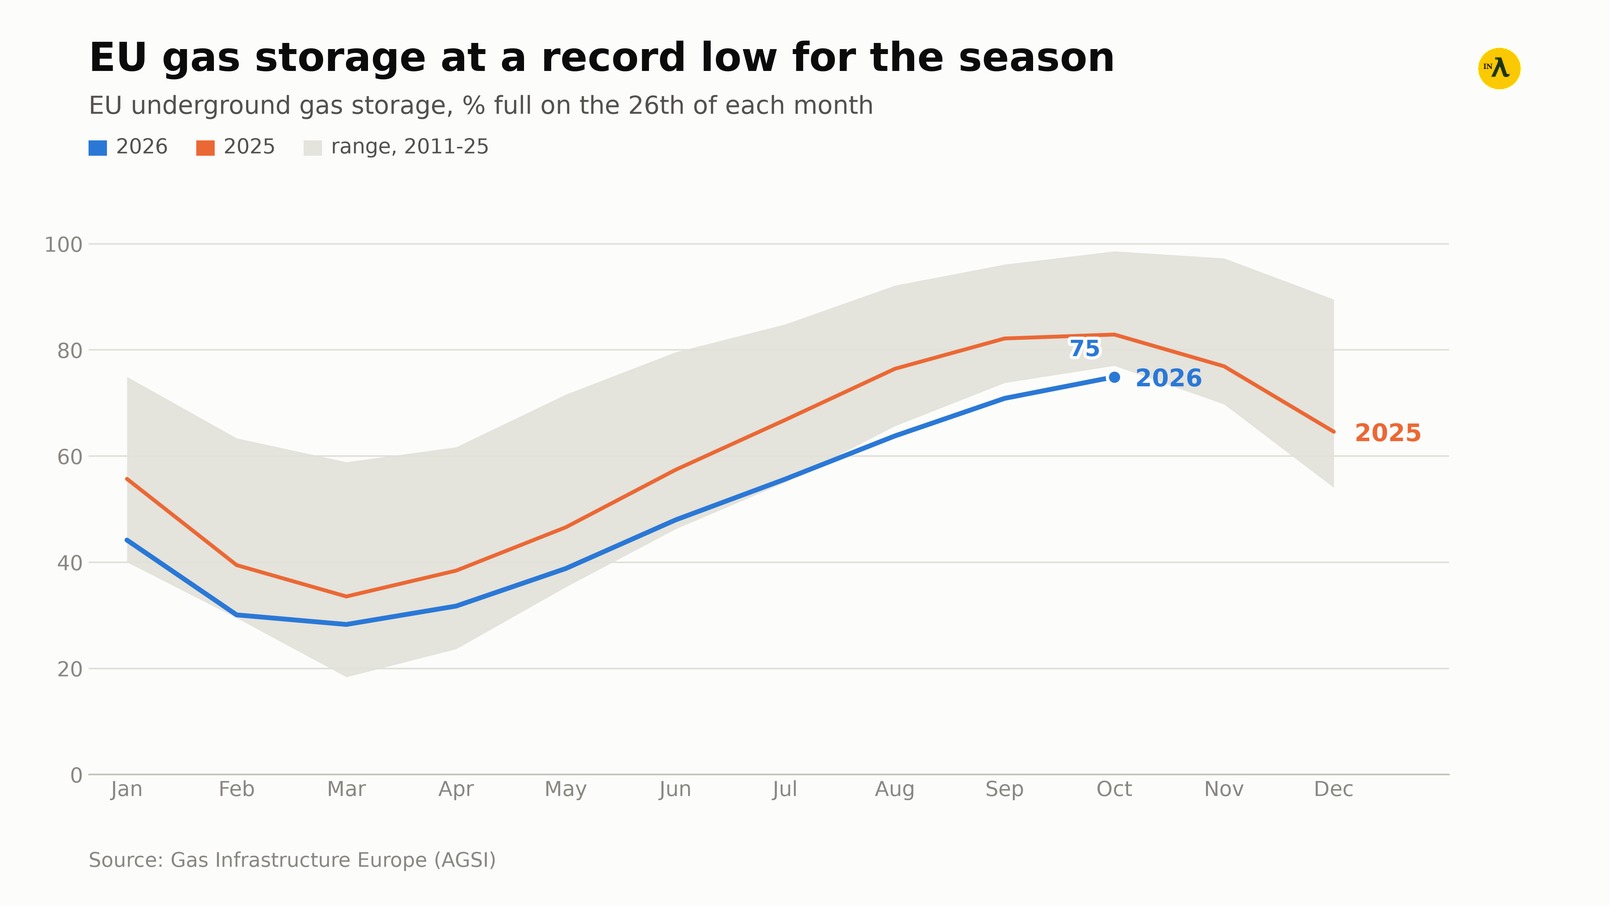
European gas prices broke €100 per MWh on October 28 for the first time since 2022, with the tanks meant to carry the continent through winter only three-quarters full, missing the EU's 90% full by November 1 threshold by 25 percentage points.
The front-month contract on the Dutch TTF hub is a long way below the peaks above €300 per MWh of 2022, but it has tripled since the US and Israel attacked Iran at the end of February, when it traded at about €35 per MWh.
Traders expect it to go higher. Goldman Sachs has forecast €150 per MWh if a cold winter coincides with a continued blockade of the Strait of Hormuz, - the UN just predicted we are on for an exceptionaly cold winter - and Gazprom chief executive Alexei Miller said on October 30 that European prices could reach $236.97 per MWh ($2,500 per 1,000 cubic metres), roughly double the current level, if the winter is cold.
EU underground storage was at a record low of 74.89% full on October 29, according to Gas Infrastructure Europe, against a five-year average of about 89.7% for the time of year and the 90% target the bloc's rules set for November 1. Germany, Europe's biggest gas consumer, was at 61.61%, and that is bad news as it has by far the largest storage tanks apart from of Ukraine, which is not used for storage anymore thanks to its war.
This will be Europe's second gas crisis in four years, and the energy ministers who met in Luxembourg on October 29 had little to offer. "We've exhausted most of our short-term options," one senior European energy official told Politico.
The first crisis was about one supplier. This one is about the end of a single world price for energy, and the gaps it is opening up in what it costs to make things in Europe, the US and China thanks to the fragmentation of the new multipolar world.
A market that no longer clears
Before Russia's invasion of Ukraine, oil and gas traded in a global commodities market where supply responded to price and a unit of energy cost roughly the same everywhere, once transport and the balance of local production and imports were allowed for. Three things have broken that: the sanctions regime built around Russia since 2022, the Iran war and the closure of the Strait of Hormuz, and a shrinking number of sellers.
To make things worse, Europe is heading into winter locked in a bidding war with Asia for LNG cargoes, with EU gas stores at record lows, the Financial Times reported on September 27.
Gas had three big exporters able to swing supply between Europe and Asia: the US, Russia and Qatar. Russia's pipeline exports to Europe are down to the last branch of TurkStream. QatarEnergy shut its 77mn tonnes a year of liquefaction capacity as a precaution in March and has extended force majeure on deliveries to the end of the year, and the EU has received no significant Qatari volumes since the summer, according to the EU energy regulators' agency ACER. That leaves the US as the marginal seller, and a market with one swing supplier is a seller's market.
Russia supplied 45% of Europe's gas five years ago. The US now provides about 30% of EU supply and its share is rising - and the Trump administration is probably less reliable and more aggressively using energy as a geopolitical weapon than Russia was. When Trump met with European Commission President Ursula von der Leyen last March, he badgered her into a $750bn three year energy deal that analysts called “delusional” at the time.
Europe has swapped one dependency for another rather than escaping it. Russian gas has not gone away entirely: the EU imported a record 12.18mn tonnes of Yamal LNG in the first nine months of 2026, according to campaign group Urgewald, ahead of a ban on Russian LNG under long-term contracts that takes effect on January 1, 2027.
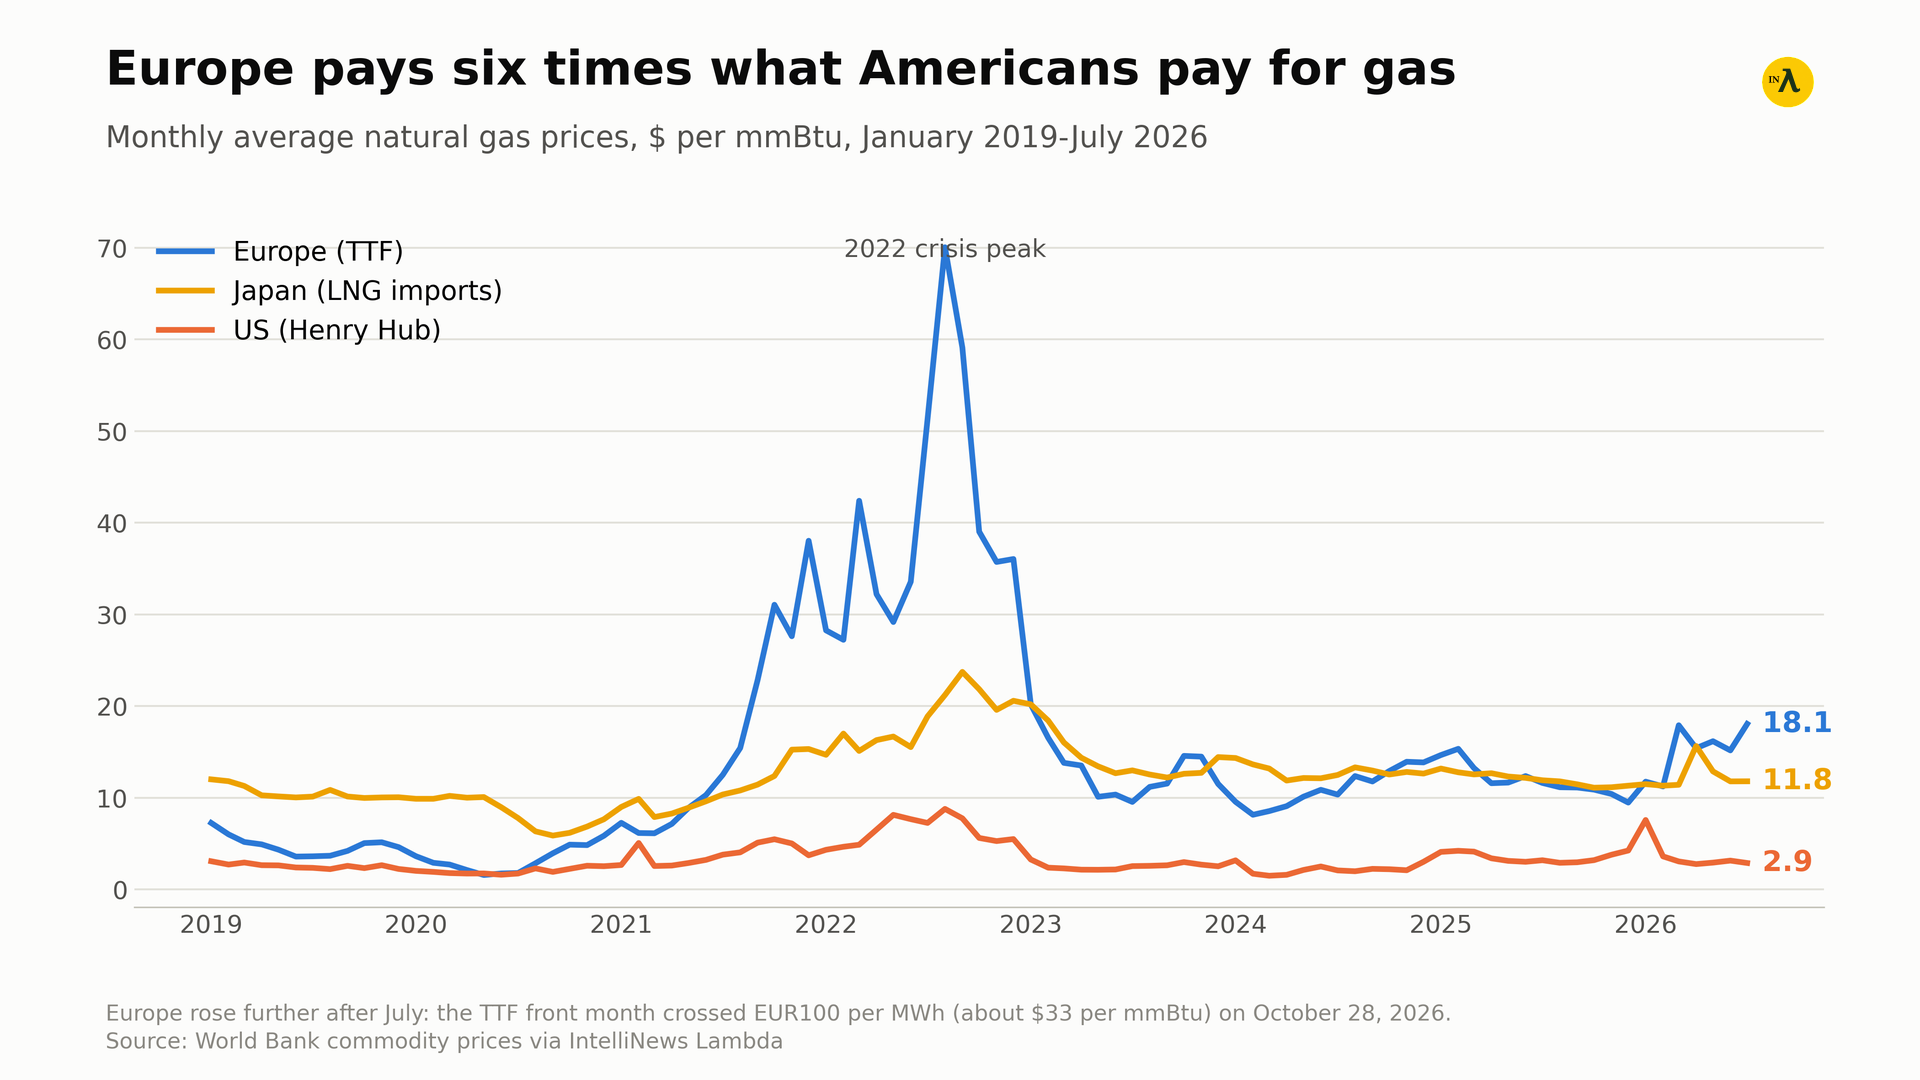
Monthly average natural gas prices in Europe, the US and Japan (LNG), $ per mmBtu, January 2019 to July 2026. Source: World Bank commodity prices via IntelliNews Lambda
Who pays what for gas
Americans paid $9.86 per MWh ($2.89 per million British thermal units, or mmBtu) at Henry Hub in July, against $61.63 per MWh ($18.06/mmBtu) for European buyers, according to World Bank data.
At October 28's TTF price, about $111.23 per MWh ($32.6/mmBtu) at the European Central Bank's October 29 rate of $1.1130 to the euro, Europe is paying roughly ten times the US price.
Inside Europe the price depends on who your supplier is. Serbia, which still buys from Gazprom under short-term extensions of an oil-indexed deal, is paying about €30.14 per MWh (€318 per 1,000 cubic metres), Aleksandar Vučić said on September 26, against a TTF-equivalent price of around €82.27 per MWh (€868 per 1,000 cubic metres) at the time, and Gazprom has extended the arrangement to the end of December. Russia accounted for 74% of Hungary's gas imports in 2025, and Slovakia wants to keep buying Russian gas beyond the EU's 2027 deadline. Germany and France, which have little gas of their own and no Russian contracts, buy at hub prices.
Readiness is also unevenly spread: Italy's storage was 90.96% full on October 29, France's 87.15% and Poland's 99.12%, while Slovakia's was 54.04%.
The cheapest gas in the world is inside the producers. Russia's heavily subsidised domestic tariff works out at about $4.74 per MWh ($50 per 1,000 cubic metres, or about $1.40/mmBtu). That gives its manufacturing industry a huge competative advantage.
China, an importer, has used its size and its political weight to lock in prices far below Europe's. Russian government forecasts put the average price of Russian gas sold to China at about $24.55 per MWh this year ($259 per 1,000 cubic metres, or roughly $7.20/mmBtu), and Beijing is holding out for about $4.74 per MWh ($50 per 1,000 cubic metres) on the proposed Power of Siberia 2 pipeline, according to the Wall Street Journal. That also gives Chinese industry a huge competative advantage. Between them, Russia and China have emerged as the two global manufacturing powerhouses as a result of the low cost of their most basic input.
Over 25 years Russia sold gas to China for as much as 30% less than to Western Europe, and as much as 77% less during the 2021-2023 price spike, Sergey Vakulenko of the Carnegie Russia Eurasia Center calculated in a paper on October 23. Central Asian producers such as Turkmenistan, which also pipes gas to China, keep their own home prices regulated.
Asia's importers are paying spot prices close to Europe's. Northeast Asian LNG was at about $102.36 per MWh ($30/mmBtu) in late October, a four-year high, while Japan's average import price was $40.26 per MWh ($11.80/mmBtu) in July, cushioned by oil-indexed long-term contracts. Further south, Bangladesh is seeking more US LNG after the loss of Qatari cargoes. The Gulf producers sit at the other end of the scale: Qatar makes all of its electricity from its own gas.
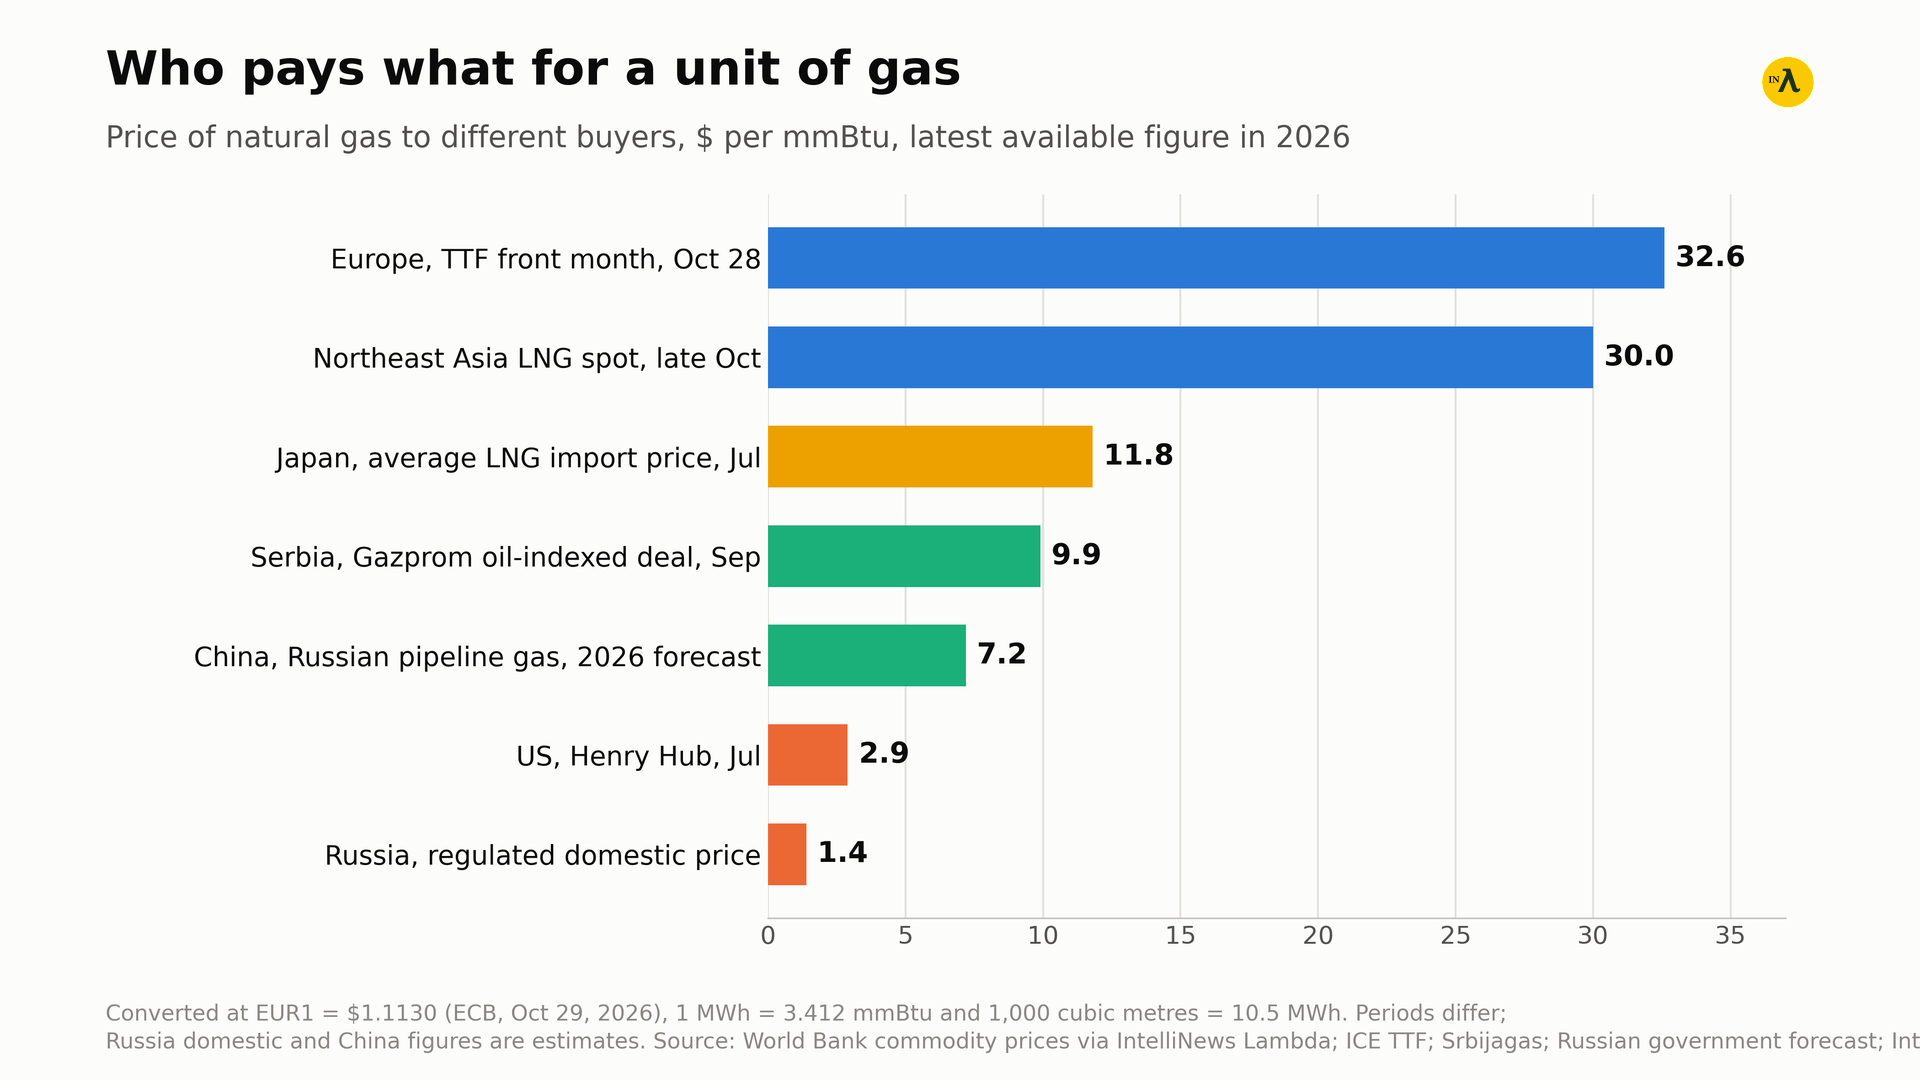
Price of natural gas to different buyers, $ per mmBtu, latest available figure in 2026; periods differ. Source: World Bank commodity prices via IntelliNews Lambda; ICE TTF; Srbijagas; Russian government forecast; IntelliNews
Oil: one barrel, many prices
The oil market, once a seemless global commodity, has also been shattered by the international brouhaha. Under the old system, a barrel was priced off Brent or Dubai, plus a discount or premium for quality and freight.
Brent was $115.22 a barrel on October 20, against an average of about $68.70 in January and February before the Iran war, after peaking at $138.21 on April 7, according to the US Energy Information Administration.
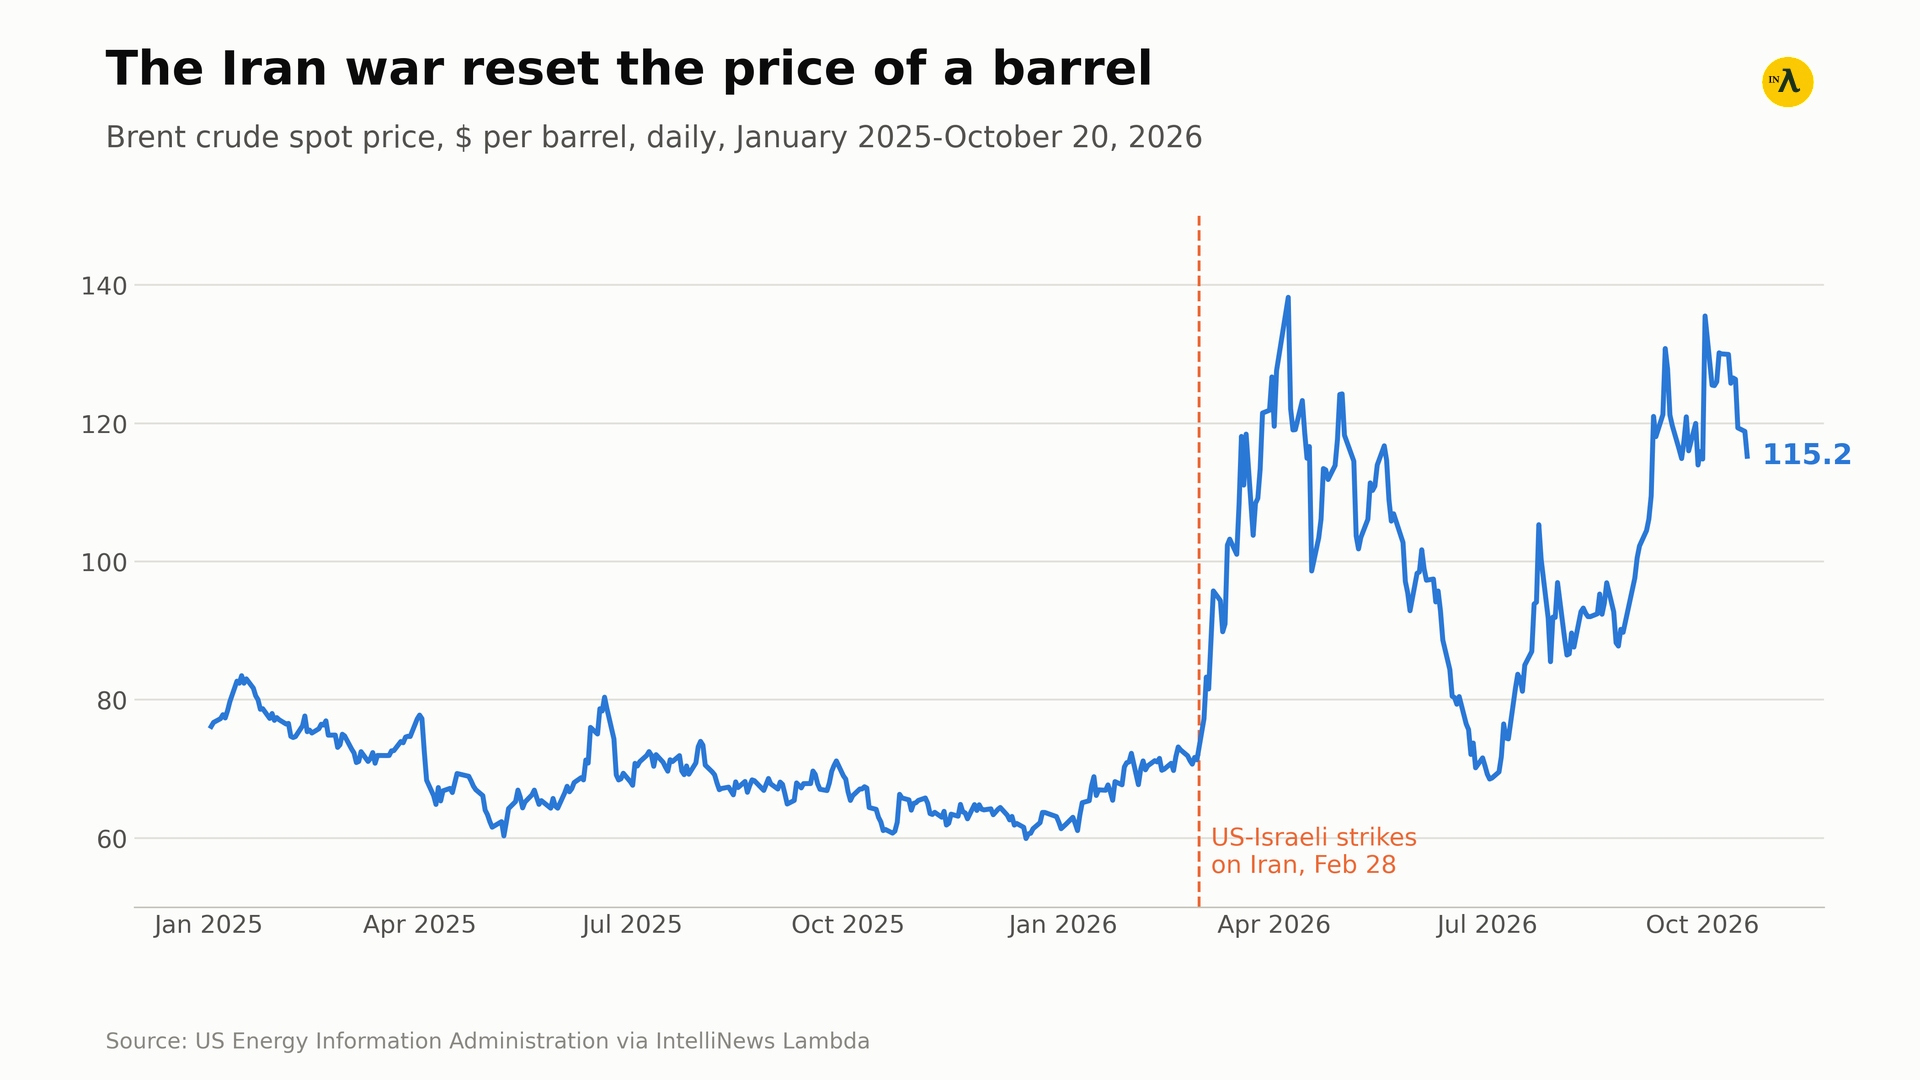
Brent crude spot price, $ per barrel, daily, January 2025 to October 20, 2026. Source: US Energy Information Administration via IntelliNews Lambda
The price of a barrel is now set less by the market than by who can get what. Sanctions have forced Russia to sell at a deep discount at its own ports: Urals traded $25.3 a barrel below Brent at the Baltic ports by mid-October and $28.4-$29.3 below at the Black Sea, according to price agency Argus. Delivered prices are a different matter. Russian Urals crude delivered to China's Shandong province commanded a record $12.50 premium over Brent futures in September, while freight costs have pushed Russian cargoes offered to India to a premium of about $2 a barrel to Dated Brent.
More recently, Indian refiners have turned to Gulf crude, with some Iraqi cargoes sold at discounts of more than $25 a barrel to Dubai, and Russia's share of India's crude imports fell to 33.5% in September from 46.6% in August because of soaring freight prices, The Economic Times reported. The toing and froing in the wars and sanctions have made the energy markets increasingly volatile.
Inside Europe, neighbours pay different prices. Russia supplied more than 90% of Hungary's oil imports in 2025, delivered by the Druzhba pipeline, while Germany stopped taking Russian pipeline crude in 2023 and buys at world prices. Taxes then widen the gap at the pump: a litre of diesel cost $2.37 in Germany in July and $1.93 in Hungary, against $1.31 in the US and $1.03 in India, according to International Energy Agency data.
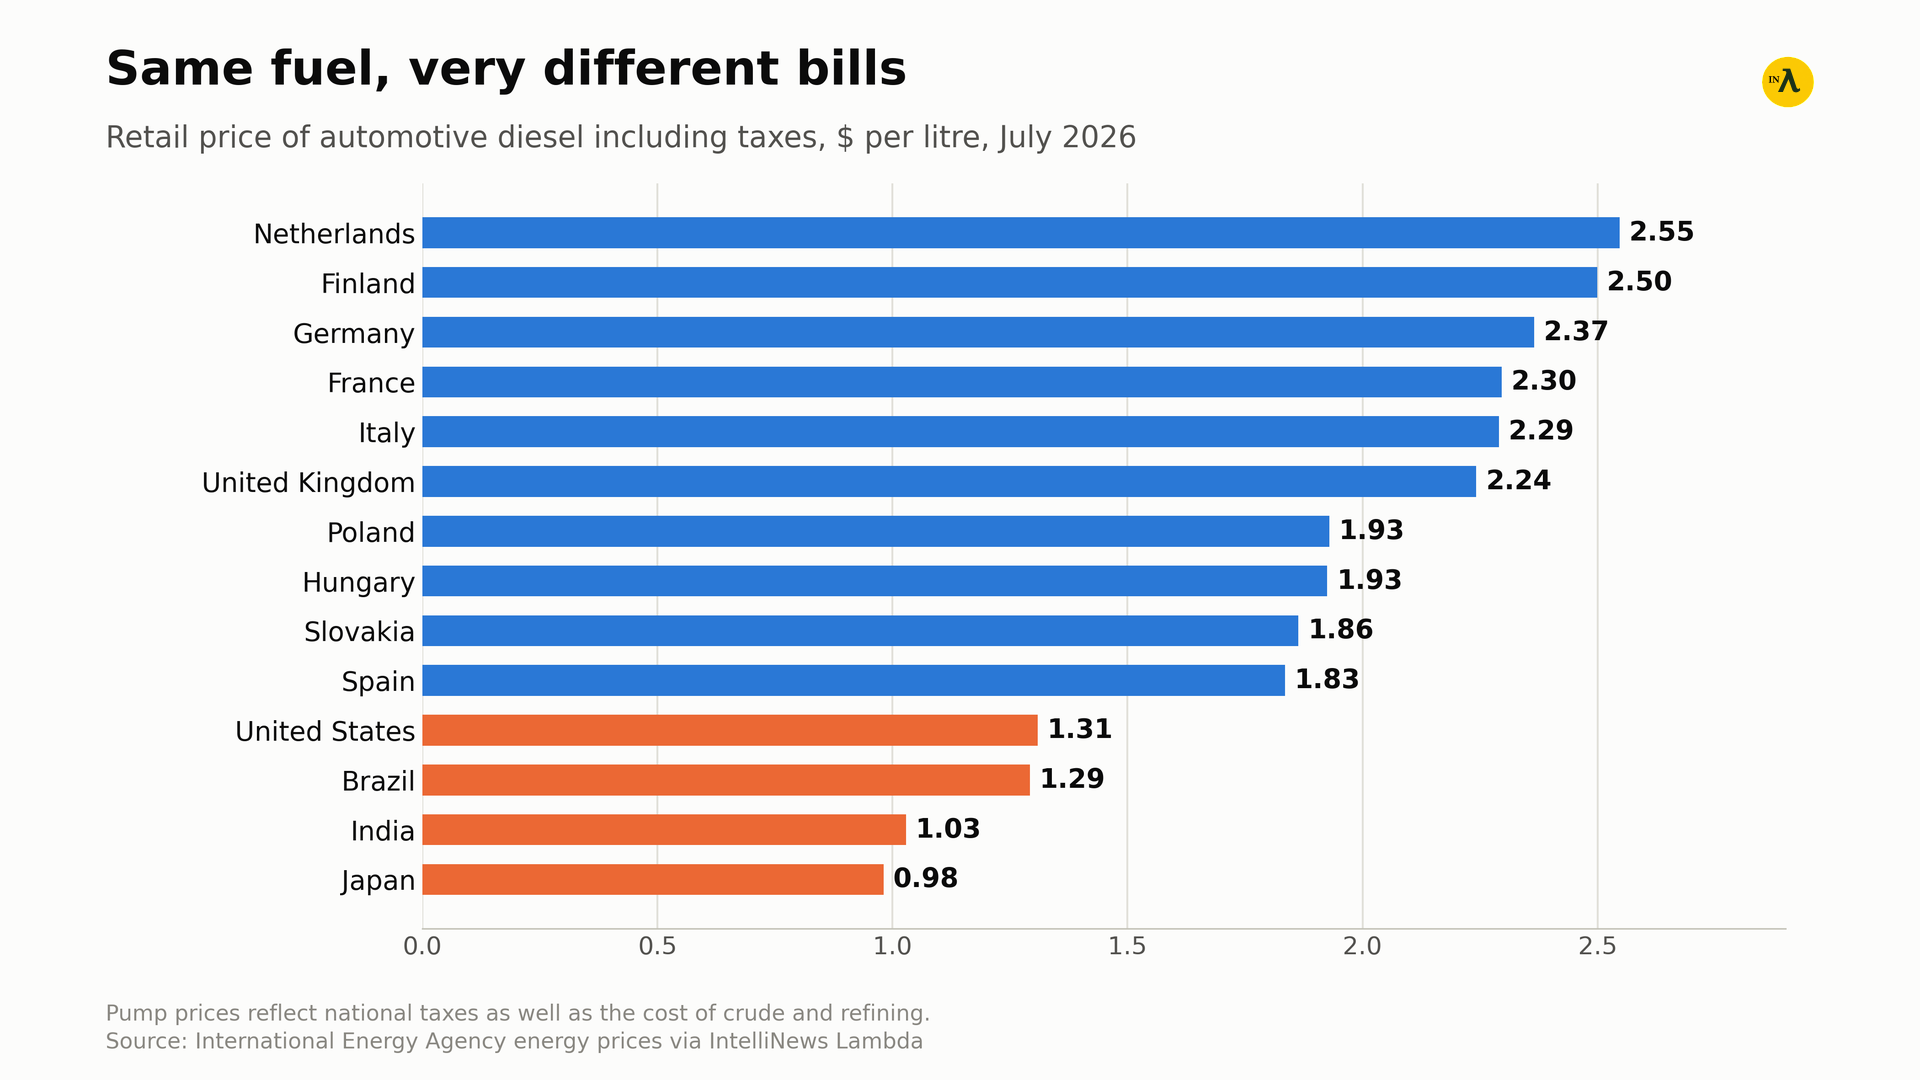
Retail price of automotive diesel including taxes, $ per litre, July 2026. Source: International Energy Agency energy prices via IntelliNews Lambda
The distortions run on into oil products. The EU has banned imports of refined products made from Russian crude, which fell in practice on the Indian refiners that buy it. Their diesel turned south to Africa, which took 37.6% of India's product exports as of July against 8.4% for Europe, on OPIS data. Europe replaced the barrels with US diesel, about 506,000 barrels a day in August, and benchmark diesel futures briefly rose above $200 a barrel after US President Donald Trump backed restricting US diesel exports on September 22 as American pump prices climbed to records.
Power: the knock-on
Electricity prices diverge even more. European industry paid an average of $226 per MWh in Germany and $327 in the UK in 2025, against $110 in the US and $89 in China, according to BloombergNEF.
Taxes, network charges and subsidies explain part of the gap, but in much of Europe gas-fired plants still set the marginal price, so expensive gas becomes expensive power.
The mix matters. Norway made 89% of its electricity from hydropower in the 12 months to September, and Sweden and Finland run almost entirely on hydro, nuclear and wind, according to Ember data. France generates 70% of its power from nuclear plants. Germany closed its last reactors in 2023: wind and solar now make 48% of its electricity, but coal and gas still make 35%. Italy burns gas for 48% of its power. China gets 42% of its electricity from clean sources and 23% from wind and solar alone, while India still relies on coal for 68%, although its renewable capacity is growing fast. The UK has built more offshore wind than anyone in Europe, and wind and solar make 41% of its power, yet its industry pays the highest price in the BloombergNEF sample, so offshore wind alone has not brought power prices down.
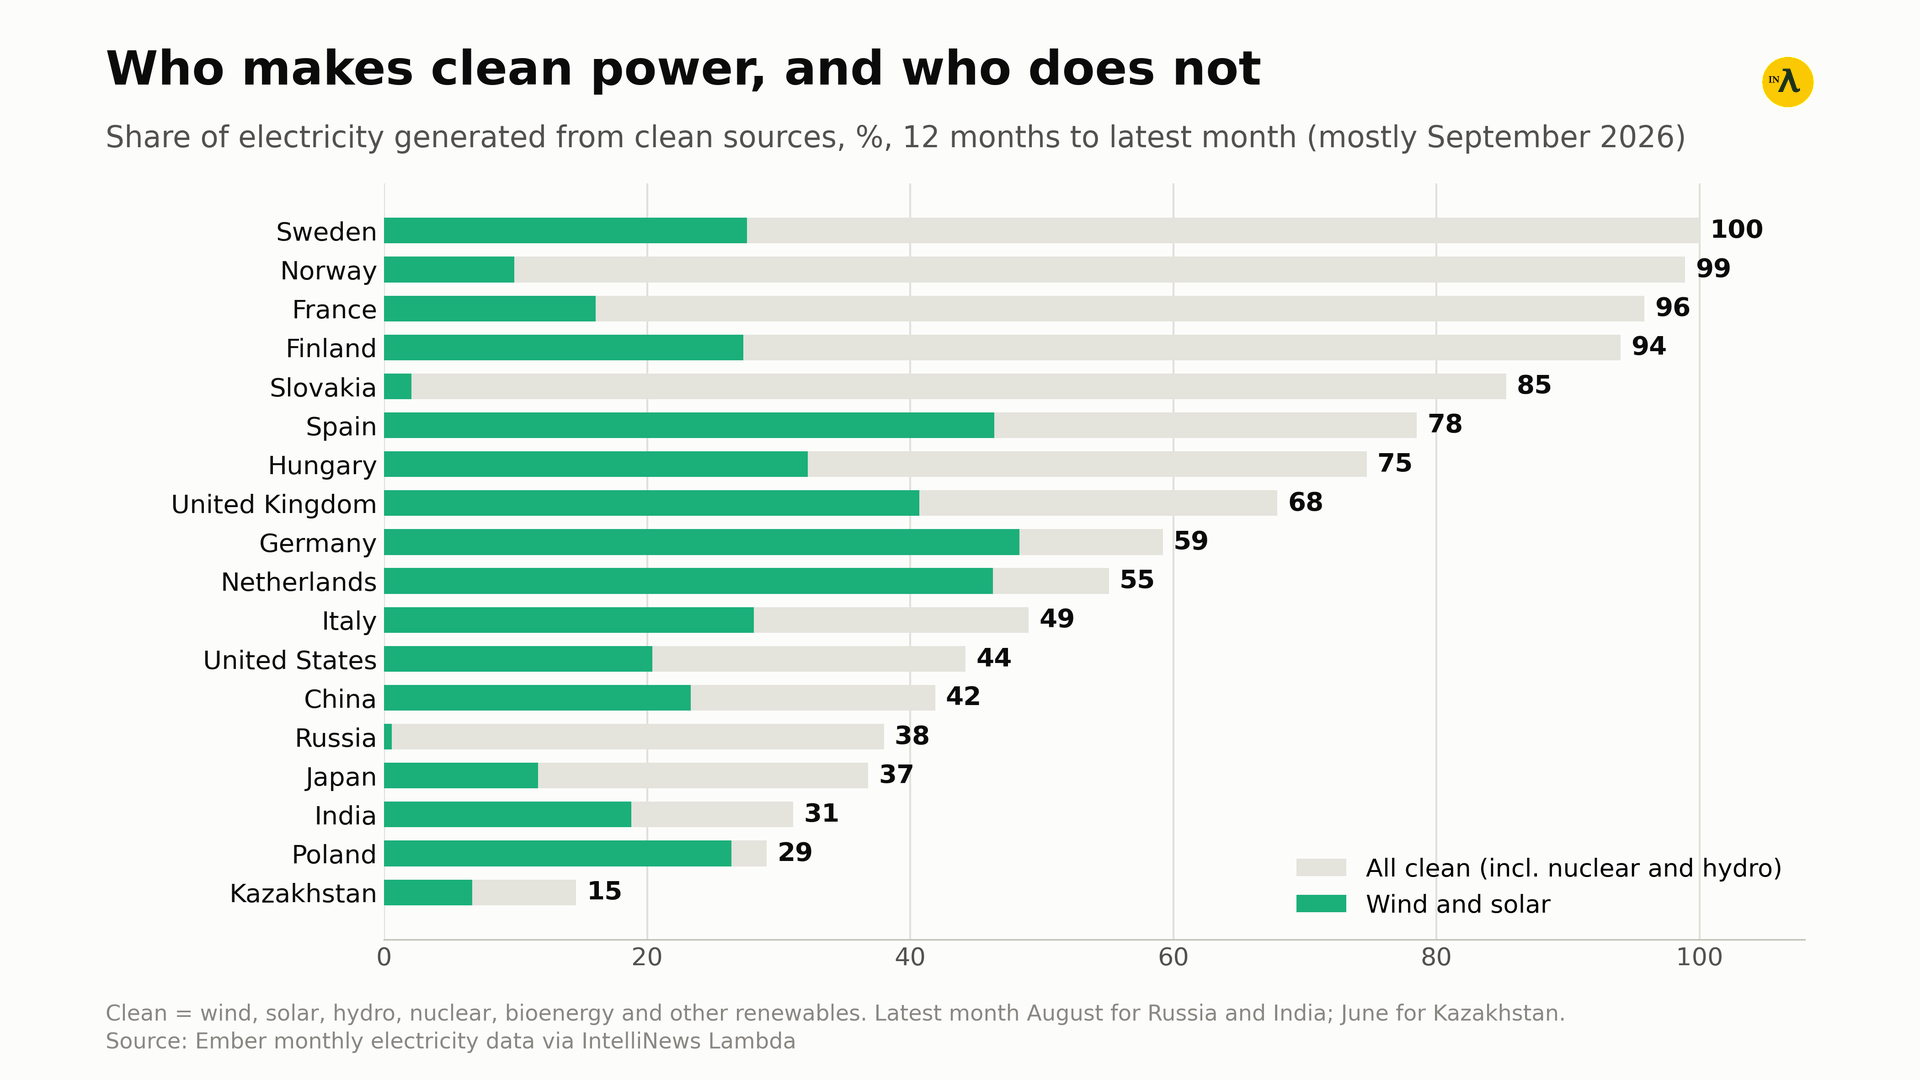
Share of electricity generated from clean sources and from wind and solar, %, 12 months to the latest month (mostly September 2026). Source: Ember monthly electricity data via IntelliNews Lambda
The price of a widget
All of this comes together in the cost of making something. Take a notional widget made from 1kg of steel, 1kWh of electricity and an hour of labour.
At mid-October hot-rolled coil prices of about €740 a tonne in northern Europe, $1,389 in the US and $500 for Chinese export offers, according to GMK Center, 2025 industrial power prices, and all-in hourly manufacturing labour costs of about $55 in Germany and less than an eighth of that in China, according to consultancy Intratec, against $48.62 in the US in June, the widget costs $56.05 to make in Germany, $50.12 in the US and $7.49 or less in China.
Labour dominates that sum, and it always has. Energy decides the next layer. For an energy-heavy widget that takes 10kWh of power and six minutes of labour, the German version costs $8.58, the American $7.35 and the Chinese $2.08, and Germany's power bill alone is two and a half times China's.
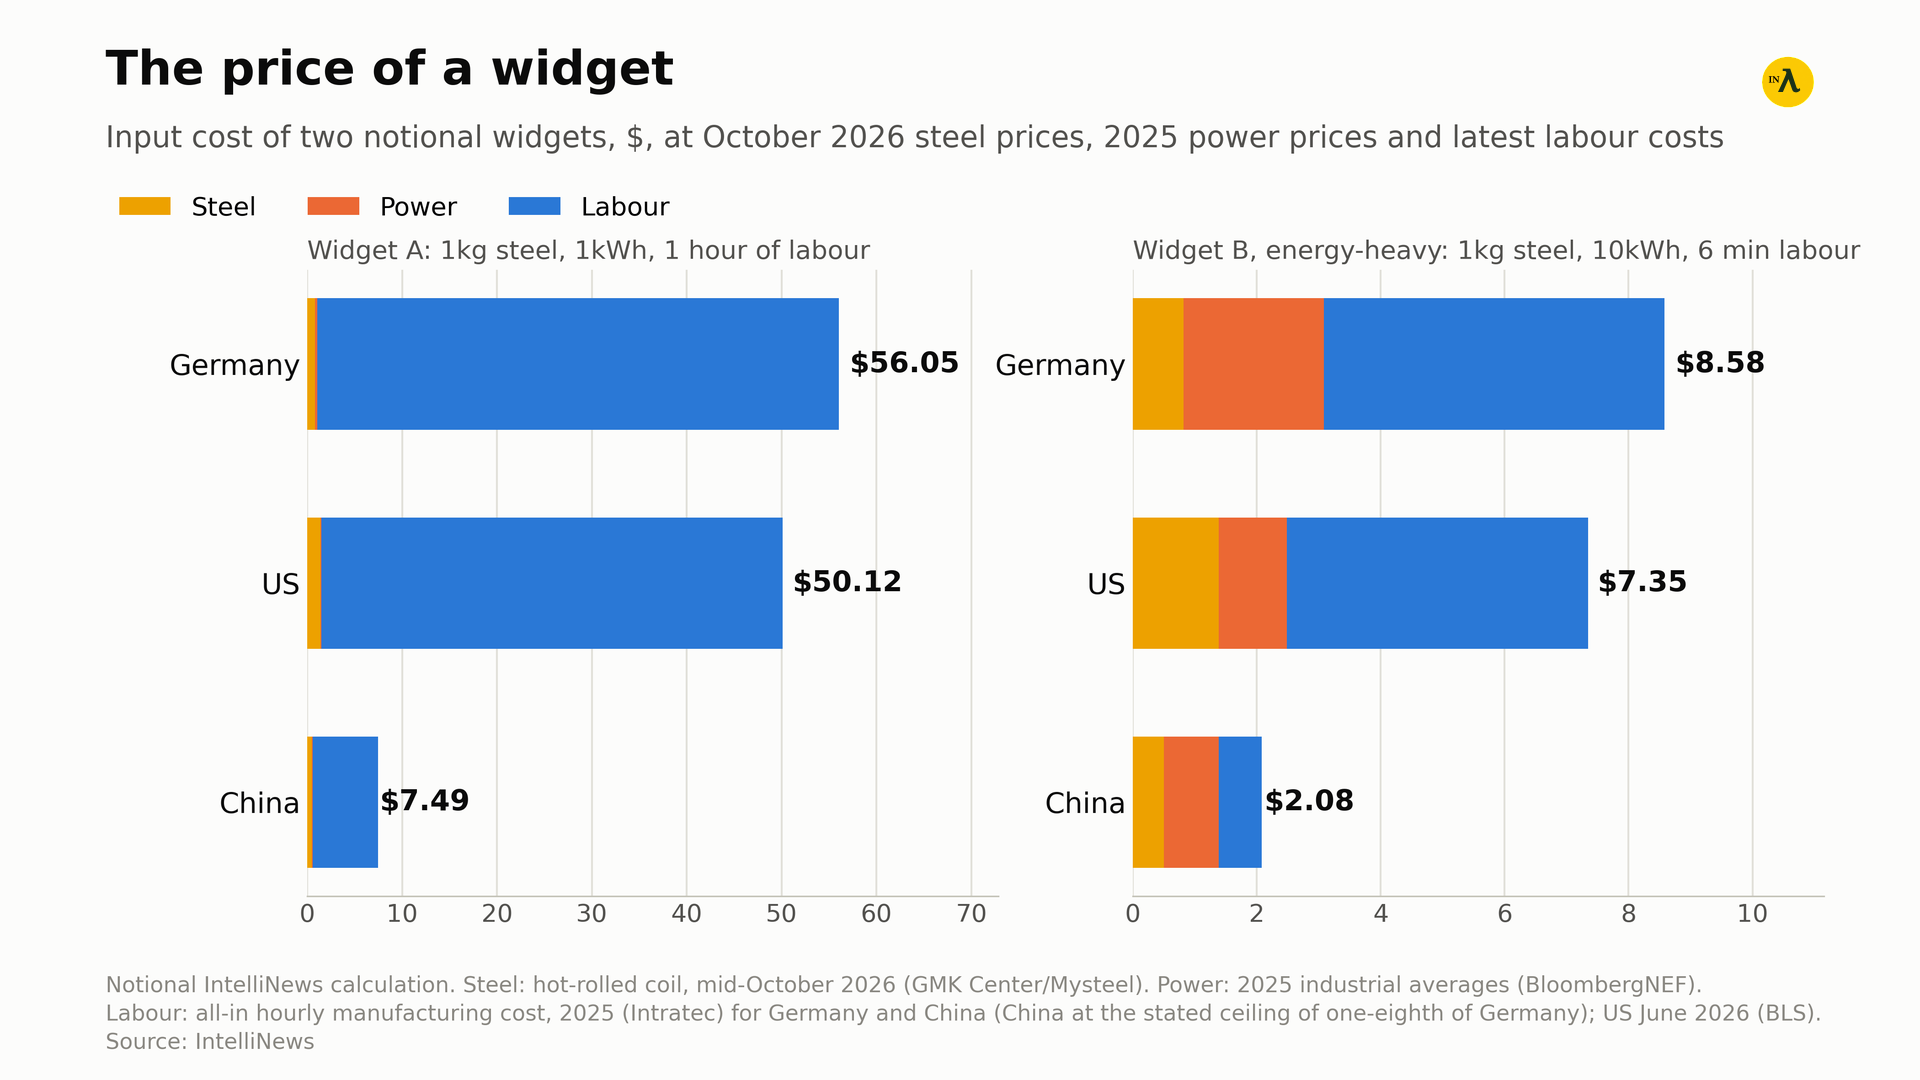
Input cost of two notional widgets, $: steel at mid-October 2026 hot-rolled coil prices, power at 2025 industrial averages, labour at all-in hourly manufacturing cost. Notional IntelliNews calculation
That gap used to be offset by quality. Germany's Exportweltmeister model rested on cheap Russian energy and better products than anyone else could make. The cheap energy has gone, and China, after years of heavy investment in innovation, is closing the gap on quality.
The EU's trade deficit with China widened to €359.8bn in 2025, as exports to China fell 6.5% to €199.6bn and imports rose 6.4% to €559.4bn. Germany has already spent €50.4bn ($56.1bn) shielding consumers and stabilising energy markets since 2022.
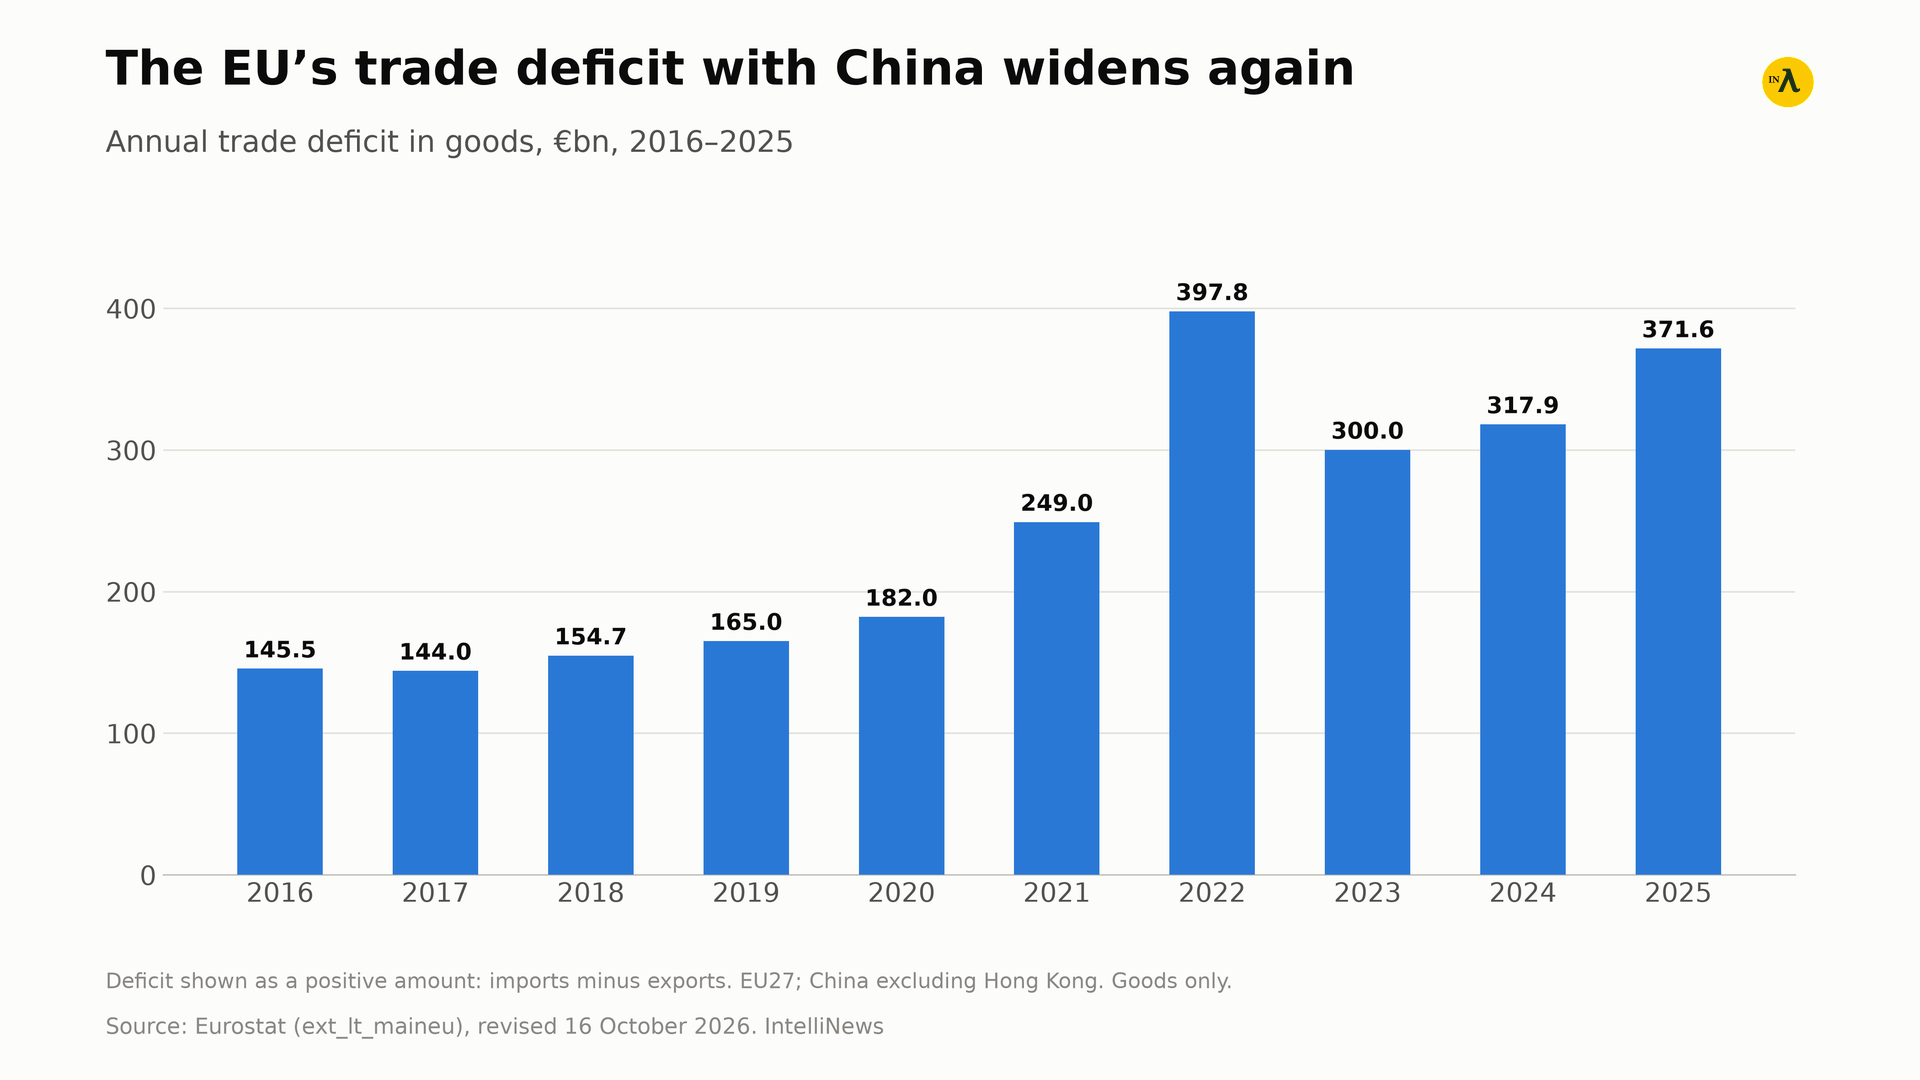
Wages in China have grown fast, overtaking those in Russia and most of the other Global South countries. But despite this the big income delta with the developed world remains the dominant factor driving China’s competitiveness. However, the soaring cost of energy has made a bad situation impossible: Europe used to have the advantage in technology and cheap Russian gas put it on a par with the Global South. It is now at a disadvantage in all three of the main widget-building inputs – a gap that it will not be able to close any time soon.
This is a structural problem, not a cyclical one, and there is no obvious fix for it. The EU's ban on Russian LNG under long-term contracts takes effect on January 1, and Gazprom says it will start exporting gas to China by a new Far Eastern route the same month.
Sources
[1] World Bank, commodity price data, natural gas prices for Europe, the US and Japan (LNG), monthly, July 2026
[2] US Energy Information Administration, Europe Brent spot price FOB, daily, October 20, 2026
[3] US Bureau of Labor Statistics, Employer Costs for Employee Compensation, private industry manufacturing, June 2026, published September 9, 2026
[4] Eurostat, EU trade in goods with China, 2025, published April 2026
This article was produced with the help of IntelliNews Lambda analytical tool
Unlock premium news, Start your free trial today.


