
US-Iran ceasefire eases oil prices but Gulf economies showing strain – Oxford Economics


A fragile two-week ceasefire between the US and Iran has led to a sharp fall in oil prices, but fresh data points to mounting economic damage across Gulf economies and rising uncertainty in Egypt, Oxford Economics said in a note to clients on April 10.
The two-week ceasefire agreement reached on April 7, includes a commitment by Iran to reopen the Strait of Hormuz ahead of further talks on April 10. Brent crude dropped more than 13% to about $93 per barrel following the announcement, slipping below $95 but remaining significantly above pre-war levels of around $65/bbl.
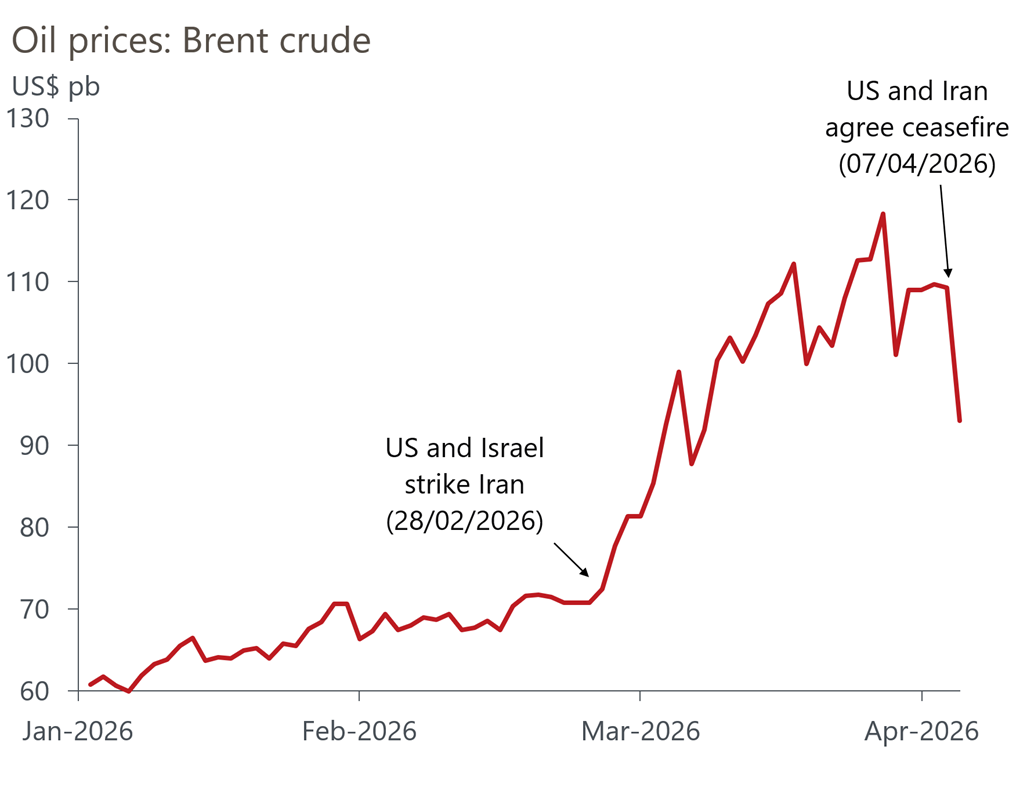
While the reopening of the Strait could ease supply disruptions, doubts persist over the durability of the truce. US and Iranian officials have issued conflicting statements on the terms, and Iran has accused Israel of breaching the ceasefire through continued strikes on Lebanon. Insurers and tanker operators also remain cautious, raising questions over how quickly normal shipping activity can resume.
Oxford Economics said that, despite the agreement, it continues to assume “a two-month Strait of Hormuz closure, followed by two more months of low-level disruption to trade”, forecasting a 0.8% contraction in Gulf Cooperation Council (GCC) GDP this year.
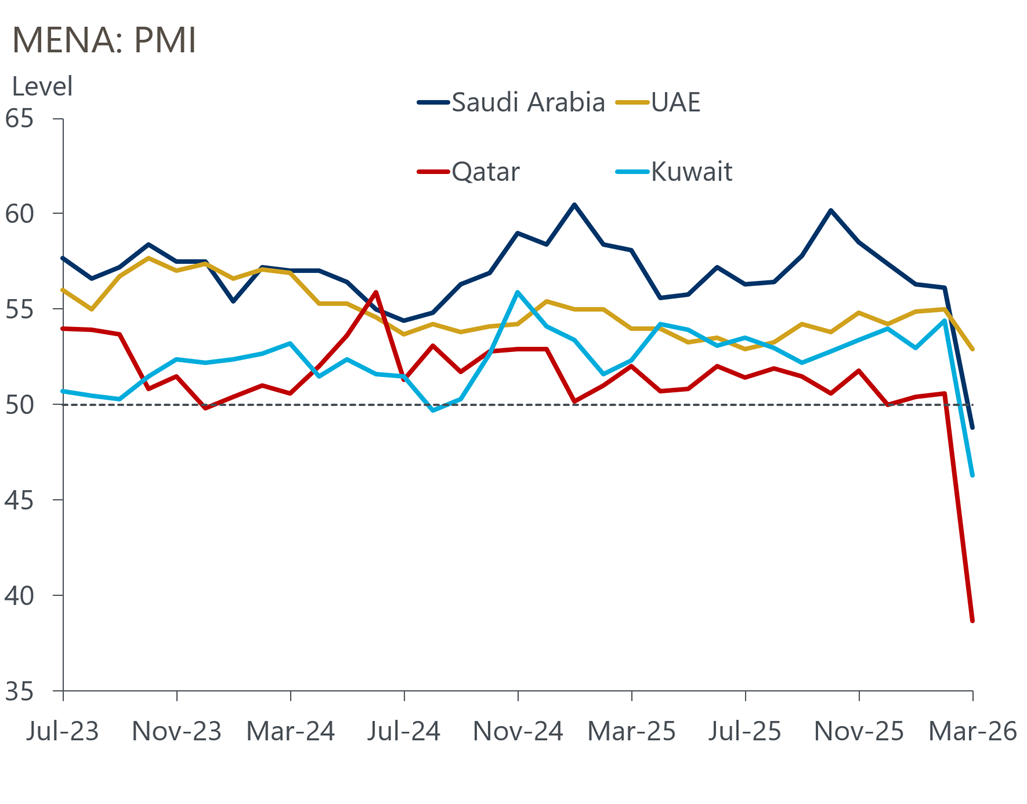
Business surveys suggest the economic impact of the conflict had already taken hold before the ceasefire. Purchasing managers’ index data for March showed sharp declines across much of the region, led by Qatar, where the PMI fell to 38.7 from 50.6, its lowest level since 2020. Saudi Arabia’s non-oil PMI dropped to 48.8, a more than five-year low, while Kuwait’s reading fell to 46.3 from 54.4.
The UAE was the only major Gulf economy to remain in expansion territory, with a PMI of 52.9, although growth in new orders slowed to its weakest pace since June 2021. Across the region, firms reported a collapse in new orders and increasingly pessimistic expectations, reflecting disruption linked to the Strait’s closure.
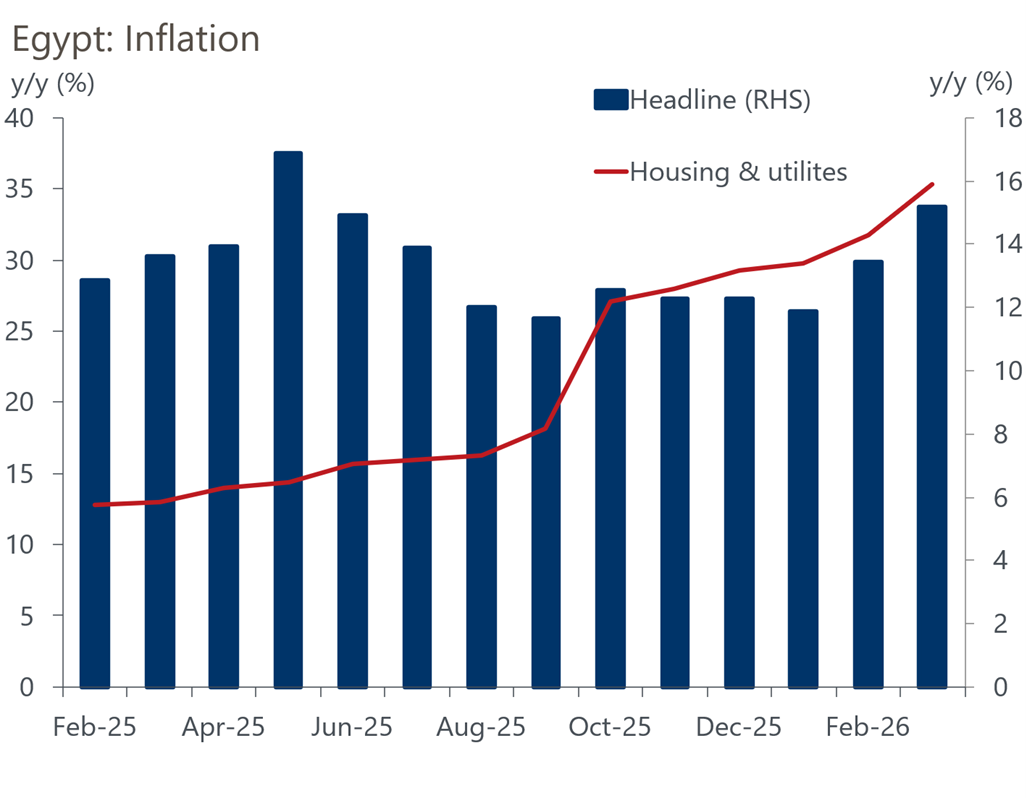
In Egypt, policymakers have opted for caution as inflationary pressures intensify. The Central Bank of Egypt held its overnight deposit rate at 19% and lending rate at 20%, citing heightened regional uncertainty. Annual urban inflation accelerated to 15.2% in March, up from 13.4% in February, driven largely by higher energy prices.
Economic activity has also weakened, with Egypt’s non-oil PMI falling to 48, marking its sharpest contraction in nearly two years. Oxford Economics expects real GDP growth to slow to 4.5% this year as trade disruption and currency pressures weigh on activity.
Moody’s affirmed Egypt’s Caa1 rating with a positive outlook, citing continued fiscal and external improvements, alongside a rise in foreign reserves to $52.8bn in March.
|
Middle East forecast overview |
||||||||||||
|
Real GDP (% y/y) |
Inflation (% y/y) |
Current Acc. |
Fiscal Balance |
|||||||||
|
2025 |
2026 |
2027 |
2025 |
2026 |
2027 |
2025 |
2026 |
2027 |
2025 |
2026 |
2027 |
|
|
World |
3 |
2.6 |
3 |
3.4 |
4 |
3.1 |
- |
- |
- |
- |
- |
|
|
MENA* |
3.4 |
-0.7 |
7.9 |
12.4 |
14.6 |
9.7 |
-3.7 |
-2.3 |
-2.4 |
-5.9 |
-4.6 |
-4.2 |
|
GCC |
4.3 |
-0.8 |
8.5 |
1.6 |
2.5 |
2.4 |
5.5 |
9.5 |
7.3 |
-3.5 |
1.9 |
0.6 |
|
Bahrain |
2.6 |
-4.6 |
6.5 |
-0.1 |
2.1 |
1.2 |
4 |
3.5 |
3.6 |
-4.7 |
-5.1 |
-4.4 |
|
Kuwait |
2.1 |
-6.9 |
11.6 |
2.4 |
2.9 |
2.6 |
23.4 |
14.3 |
12.1 |
-5.9 |
-11.8 |
-10.4 |
|
Oman |
2.1 |
2 |
2.3 |
1 |
1.9 |
1.6 |
-0.3 |
4.6 |
-1.6 |
-1.1 |
4.4 |
-1.1 |
|
Qatar |
3 |
-11.2 |
25.5 |
0.5 |
3.5 |
2.6 |
13.4 |
29.4 |
26.3 |
-1 |
5.7 |
8 |
|
KSA |
5.3 |
2.6 |
6 |
2.3 |
2.2 |
2.7 |
-2.5 |
3.1 |
-0.5 |
-5.8 |
0.2 |
-1 |
|
UAE |
5.5 |
0.3 |
8.3 |
1.2 |
2.1 |
1.8 |
16.1 |
18.6 |
17.2 |
4.3 |
6 |
4.2 |
|
Algeria |
3.8 |
2.7 |
2.7 |
1.8 |
4.8 |
6.2 |
-4.3 |
0.8 |
-2.9 |
-13.1 |
-8.3 |
-9.8 |
|
Egypt |
5.1 |
4.5 |
4.9 |
14.1 |
11.9 |
7.7 |
-2.9 |
-5.9 |
-3.4 |
-7 |
-6.7 |
-6.7 |
|
Iran |
0.2 |
-9.4 |
9.1 |
46 |
66.8 |
24.3 |
-0.8 |
-6.9 |
-4.8 |
-3.9 |
-5.4 |
-4.6 |
|
Iraq |
-1.1 |
-19.4 |
30.3 |
0.3 |
1.9 |
2.6 |
5.8 |
8 |
6.1 |
-4.3 |
-13.4 |
-6.5 |
|
Israel |
3.2 |
3.1 |
6.1 |
3 |
2.2 |
1.9 |
1.5 |
2.1 |
2.5 |
-4.7 |
-5.3 |
-4.5 |
|
Lebanon |
1.1 |
-5.5 |
12.9 |
14.6 |
17.8 |
15.6 |
-17.6 |
-22.4 |
-16.6 |
-0.6 |
-0.6 |
-0.8 |
|
Libya |
12.3 |
8.2 |
3.2 |
2.1 |
4.4 |
2.1 |
-9 |
3.8 |
-7.3 |
-30 |
-11.6 |
-9.4 |
|
Jordan |
2.7 |
3.2 |
3 |
1.8 |
1.6 |
1.8 |
-1.1 |
1 |
2.4 |
-5.5 |
-5.7 |
-5.8 |
|
Morocco |
4.6 |
4.2 |
3.7 |
0.7 |
1.3 |
1.9 |
-1.9 |
-1.9 |
-2.4 |
-3.6 |
-3.9 |
-4.1 |
|
Tunisia |
2.5 |
1.9 |
1.4 |
5.3 |
5.3 |
4.8 |
-2.6 |
-4.8 |
-3.6 |
-4.9 |
-5 |
-4.3 |
|
Sources: Oxford Economics, Haver Analytics, Bloomberg, IEA |
||||||||||||
Unlock premium news, Start your free trial today.


