
IntelliNews Lambda: China selling off US T-bills in preparation for White House clash


China’s holdings of US Treasuries have been falling since 2012 as tension with the US grows, but that has accelerated dramatically after the war in Ukraine broke out as Beijing seeks to sanction-proof its economy and reduce US leverage.
China seems to be following Russia’s playbook that also started to sell off its US treasury bills in 2012 as tensions grew, but the Kremlin dumped nearly all its holdings in just two months in 2018 after the US sanctioned most of its oligarchs, taking the fight to a new level. By the time Russia’s troops cross the border into Ukraine in February 2022 it has almost no T-bills left and had paid off most of its external debt, making it extremely difficult to sanction.
Relations with Brazil and India, the other two core members of the BRICS family, also enjoyed much better relations with the US under the Biden administration. But since US President Donald Trump took office just over a year ago, they too have suddenly started selling T-bills - a move that accelerated after Trump rolled out his Liberation Day tariffs. Both Brazil and India were hit with tariffs that they complained were unfair. Trump hit Brazil with sweeping 50% tariffs in what were widely seen as politically motivated for failing to rehabilitate Jair Bolsonaro, a personal friend of Trump’s, who was facing criminal charges for allegedly plotting a coup d'état following his 2022 election defeat. Likewise, Trump doubled Indian tariffs around the same time after New Delhi refused to end its import of Russian oil.
Coupled with Trump’s increasingly aggressive sabre rattling, the use of the military to decapitate the Venezuela government of Nicolas Maduro, and the threat to invade Greenland, governments everywhere are diversifying their interests away from the US as Trump systematically dismantles the international rules-based order as part of his “America First” policies.
The Chinese sell off
The selling of T-bills is not a smooth process, and the pace depends heavily on where one draws the line between old policies in an increasingly hot room, and the chill that set in after the Ukrainian invasion.
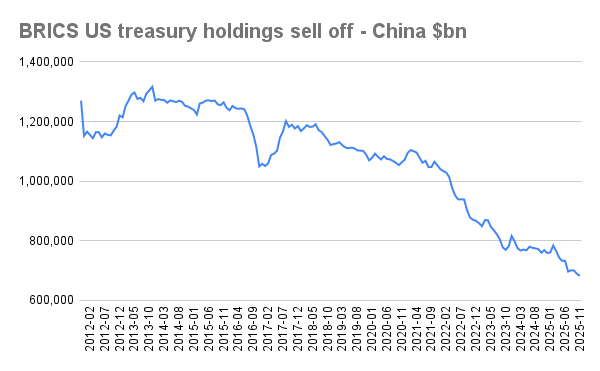
US Treasury TIC data on “Major Foreign Holders” show China’s peak holding of treasury bills at $1.316 trillion in November 2013, slipping to $682.6bn by November 2025 - a decline of roughly half over 12 years.
Russia has sold off almost all of its T-bills, but for the sake of argument, the analyst below calculates an end point where China’s treasury holdings fall to $100bn or below as the point where any remaining holds can be speedily dumped on the open market and seizing these assets ceases to be a large fiscal shock for the Chinese government.
China’s sell off has happened in three broad stages as part of Beijing’s attempt to reset relations in a multipolar world order setting – an approach Trump has now explicitly rebuffed with the release of the National Security Strategy (NSS) in December that revives the Monroe Doctrine and claims control of the Western hemisphere for America.
First phase: running from China’s November 2013 peak treasury holdings through December 2017, the decline calculated by IntelliNews Lambda is about $43bn a year. Extrapolated mechanically using a linear regression, the pace of this slow-burn diversification would not take holdings below the $100bn mark until early October 2041.
Second phase: the pace of selling picked up in the second phase between December 2015 and November 2021. The fitted decline steepens to about $54bn a year, bringing the implied $100bn-date forward to mid-September 2037.
Third phase: A much sharper inflection is centred on early 2022. A regression from February 2022 — the month of the invasion of Ukraine — to November 2025 yields a faster implied decline of roughly $72bn a year, pointing to a crossing below the $100bn mark in late 2033.
The geopolitical backdrop hardened decisively with Russia’s full-scale invasion of Ukraine on February 24, 2022, which ushered in an era of much broader financial sanctions risk. That raised an obvious question for major reserve holders: whether exposure to US-controlled payment systems and assets could become a strategic vulnerability. Chinese President Xi Jinping greatly increased that risk with his Moscow trip in March 2023 when he declared a “no limits” partnership with Russia. With this visit, Xi openly defied Western pressure to break off relations with Russia and pledged China’s support for Russia in what has been billed a proxy war between the West and the East.
However, the Treasury data suggest the key policy decision to back Russia had already been made a year earlier as Beijing accelerated its T-bill sales. In the first year of the war, Beijing was still hoping a ceasefire deal could be struck. It offered a 12-point Chinese peace plan to end the conflict on the first anniversary of the war, offering to intermediate, but the offer was refused as the Armed Forces of Ukraine (AFU) had the upper hand at the time. But in parallel it prudently continued to sell T-bills.
Russian sell off
Russia provides the clearest precedent for how Treasury holdings can act as an early-warning indicator of geopolitical rupture. Unlike China, whose drawdown remains gradual and incomplete, Moscow’s divestment became abrupt and near-total when it directly clashed with the US.
Relations between Russia and western capitals had been deteriorating steadily through the 2000s, but the decisive break came with the annexation of Crimea in 2014 and the start of the 'sanctions era'.
The seizure prompted the first major wave of US and EU sanctions, marking the moment when financial assets held under western jurisdiction began to be seen in Moscow not merely as reserves, but as potential liabilities.
From that point, Russia’s Treasury reduction became less an exercise in portfolio management and more a strategic hedge. The Kremlin had begun to internalise the risk that a future escalation could end with asset freezes, exclusion from dollar clearing, or worse.
Putin famously complained about Nato’s expansion in his 2007 Munich Security Conference (MSC) speech, but he soon began actively preparing for a showdown. Also in 2007 the Central Bank of Russia (CBR) began actively accumulating gold, reducing the external debt and accumulating cash reserves. In 2012, Putin ignored calls by then Finance Minister Alexei Kudrin to launch a massive infrastructure programme and instead channelled every spare ruble into modernising the military. The selling off of T-bills came relatively late in the process, starting in 2014.
Russia’s Treasury sell-off is far more abrupt - and more revealing - than China’s gradual decline, with one moment standing out as a clear strategic regime break.
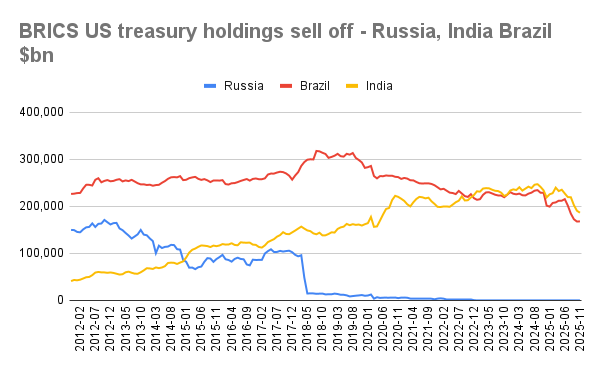
Through 2014–17, Moscow’s holdings fell steadily after the Crimea annexation and the first wave of western sanctions. Russia reduced its Treasury stock from roughly $132bn in early 2014 to around $86bn by the end of 2014, before stabilising in the $70–100bn range over the next two years. This looked like a controlled diversification rather than an outright exit as in the interregnum – which included the whole “collusion” scandal – Putin was still hoping to repair relations with the West, and Europe in particular.
The real inflection point comes in spring 2018, when the data show an extraordinary liquidation. Russia’s holdings dropped from $96.1bn in March 2018 to $48.7bn in April, and then to just $14.9bn in May - an 85% collapse in two months. From that point onward, Russia’s Treasury exposure became largely residual, falling into low single-digit billions, well before the troop build-up of late 2021.
What triggered the sell off was US sanctions on all Russia’s oligarchs, although the markets at the time failed to make the connection between politics and bonds and speculated that the CBR was just making a “portfolio adjustment” moving money out of bonds and into gold.
In January 2018 the US Department of Treasury issued the 'Kremlin Report' that included the 210 names of Russia's richest tycoons, officials close to President Vladimir Putin, and the CEOs of Russia's largest state corporations. The list was met with bemusement in Moscow as the list of oligarchs almost exactly matches the previous year’s Russian Forbes magazine rich list of Russian businessmen worth more than $1bn. The USDT followed up by hitting individual oligarchs with sanctions, singling out aluminium oligarch Oleg Deripaska (RusAl) , who was particularly close to Putin, for the most extreme measures. This was the first time the inner circle of the Kremlin had been targeted by the sanction’s regime.
This step change underscored the fact that sanctions were no longer confined to symbolic lists but could rapidly disrupt the balance sheets of major corporations and cross-border financial operations. It led to a decisive reassessment of risk: the Kremlin appears to have concluded that dollar assets held in western jurisdictions were no longer safe strategic stores of value. Even if the liquidation decision had been developing over time, the April 2018 sanctions round likely served as the decisive catalyst - accelerating the shift from gradual trimming to near-total overnight exit.
The broader implication is that Treasury holdings can act as a kind of geopolitical barometer. Russia’s 2018 portfolio collapse suggested a leadership shifting to a war footing, preparing for a future confrontation that could culminate in financial containment. By the time of the February 2022 invasion, Moscow’s Treasury holdings were already close to zero.
China — Three-stage Treasury reduction
|
Phase |
Period |
Start holdings ($bn) |
End holdings ($bn) |
Total sold ($bn) |
Avg sold per year ($bn/yr) |
% reduction |
|---|---|---|---|---|---|---|
|
1. Early diversification |
Nov 2013 – Dec 2017 |
1,316.7 |
1,184.9 |
131.8 |
~33.0 |
–10.0% |
|
2. Gradual decade-long decline |
Dec 2015 – Nov 2025 |
1,246.1 |
682.6 |
563.5 |
~56.4 |
–45.2% |
|
3. Post-Ukraine acceleration |
Feb 2022 – Nov 2025 |
1,028.7 |
682.6 |
346.1 |
~95.0 |
–33.6% |
|
Most recent pace (steepest) |
Jan 2025 – Nov 2025 |
760.8 |
682.6 |
78.2 |
~118.7 |
–10.3% |
Key takeaway:
China’s sell-off rate rises from about $33bn/year pre-2018 to roughly $95bn/year after Ukraine.
Russia — Key strategic liquidation phases
|
Phase |
Period |
Start holdings ($bn) |
End holdings ($bn) |
Total sold ($bn) |
Avg sold per year ($bn/yr) |
% reduction |
|---|---|---|---|---|---|---|
|
1. Crimea shock + first sanctions |
Jan 2014 – Dec 2014 |
131.8 |
86.0 |
45.8 |
~45.8 |
–34.8% |
|
2. Post-Crimea gradual trimming |
Dec 2014 – Mar 2018 |
86.0 |
96.1 |
–10.1 (flat) |
~0 |
~0% (stabilised) |
|
3. Strategic exit (2018 liquidation) |
Mar 2018 – May 2018 |
96.1 |
14.9 |
81.2 |
~487 (annualised) |
–84.5% |
|
4. Residual depletion pre-invasion |
May 2018 – Jan 2022 |
14.9 |
4.5 |
10.4 |
~2.8 |
–69.8% |
|
5. Final disappearance after invasion |
Jan 2022 – Jan 2023 |
4.5 |
0.07 |
4.4 |
~4.4 |
–98.5% |
Key takeaway:
Russia’s Treasury exit was not gradual — it was defined by an abrupt 85% collapse in spring 2018, years before the 2022 invasion
China’s step change trigger
At the current pace of accelerated reduction, China’s Treasury holdings would not fall below $100bn until September 2030, based on a straight-line extrapolation of the most recent 2025 trend.
Russia’s experience, however, shows that this kind of mechanical forecast can break down abruptly once sanctions risk shifts from theoretical to immediate. In Moscow’s case, the April 2018 US sanctions round triggered a near-total liquidation in just two months.
For the sake of argument, assume Washington imposed sweeping financial and personal sanctions on the leading Chinese lights on January 1, 2027, creating a Russia-style shock that forced Beijing to exit at a similar proportional speed.
China currently holds roughly $680–700bn of T-bills. Its exit would be harder as it is far more embedded in the global financial system than Russia ever was. Dumping $700bn of American bonds in two months would have a significant impact on bond prices and cost Beijing dearly.
China’s vast holdings have been cited by some observers as a “nuclear option” in a Chinese-American trade war, with the US economy seen as vulnerable to Chinese selling that could drive up yields. But the Russian experience shows there is a less damaging way of leaving the market that doesn’t boomerang back to unduly reduce the value of China’s own holdings. And the market is big and liquid enough, so can support a lot of selling: major foreign holders of US debt accounted for $6.21 trillion of current debt, while the total public debt outstanding is around $21.3 trillion as of January 2026.
Taking Russia’s exit, where it sold $81bn worth of bills in 60 days, as a benchmark for the maximum pace without causing chaos on the market, and assuming by January next year China still has some $570bn of T-bills, given the current pace of selling, then it would still take China nearly a year to close its Treasury bill holding on around December 1, 2027, but of course if Beijing were willing to take bigger losses it could go faster.
Brazil and India sell offs
Brazil and India meanwhile provide an important contrast to the China and Russia cases. Neither country has faced the same degree of strategic confrontation with Washington, and their Treasury holdings do not display the abrupt, sanctions-driven liquidation seen in Moscow or the sustained post-2022 acceleration evident in Beijing. But both countries have noticeably started to also sell off their T-bills.
A critical turning point for the world’s central bankers came in March 2022, when the West effectively weaponised the dollar-based financial system. Russia was cut off from key international payment channels and, more significantly, roughly $300bn of Russian central bank reserves were frozen abroad. The episode marked a profound break with the long-standing assumption that sovereign reserves held in major currencies were effectively sacrosanct. For central bankers globally, it raised the question of whether even state assets could be immobilised in a severe geopolitical confrontation. And with Trump in charge of the US that is not a remote possibility.
The result has been a gradual but visible erosion of trust in the safety of dollar assets - including instruments such as US Treasury bills. Reserve managers have been motivated to reduce exposure to US-controlled jurisdictions. The share of the US dollar in reserve baskets has fallen quickly. Only this week, Xi made his most explicit call yet for other countries to adopt the renminbi as a reserve currency. The process of de-dollarising trade settlement deals is accelerating . The BRICS countries are actively working on a digital alternative currency, BRICS Pay, with which to conduct trade.
For countries such as Brazil and India, however, the adjustment has been slower and more recent. They are still at the prudent risk managing stage that China and Russia were at, at the start of the process.
Brazil’s holdings were broadly stable through most of the past decade, even rising above $300bn in 2018–19, before a clearer decline emerged after 2022, slipping from roughly $237bn in early 2022 to around $214bn by early 2023. India’s holdings climbed steadily into the $200bn-plus range after the pandemic, reaching about $232bn in January 2023, with only modest trimming since. However, in both countries the governments have noticeably accelerated their sell off in a second phase since Trump took office.
Unlock premium news, Start your free trial today.

