
DATACRUNCH: Old bangers and Chinese EVs: Europe's cars grow old while war-torn Ukraine goes electric now with electric cars


Sales of new electric cars in Russia jumped by a quarter (24%) year-on-year in the first half, as the country continues to grapple with petrol shortages and supply disruptions in some regions.
According to Avtostat, 8,367 new EVs were sold in the first eight months of 2026, while analysts estimate another 5,000 are already in Russia but have yet to be registered. In parallel imports of electric cars from other former Soviet states jumped 120% year-on-year in July, while demand for home charging stations has risen 64%.
Sanctions and China’s accession to global EV-maker leader have had a dramatic impact on the global automotive sector. Russia's car industry is still growing, but it is doing so cut off from the global car business. Local manufacturers now make more than 50 passenger car models under more than 20 brands, and several dozen more in the light commercial vehicle, truck and bus segments, First Deputy Prime Minister Denis Manturov told TASS at the Eastern Economic Forum in Vladivostok on September 4.
Lada is no longer the only Russian name on the road. Alongside it are Moskvich, Volga, Yandex's UMO, Tenet, Esteo, Evolute, Belgee, Knewstar, SKM, KGM, KAMA, Solaris, Xcite and Amberauto. Manturov said splitting output across brands was mostly a marketing choice for the companies. "Increasing the number of brands is not an end in itself," he said, and carmakers decide for themselves how to position their vehicles. The range is wide, but it is built for a closed domestic market and not as part of the international supply chains Russian car-making belonged to before 2022.
In a country famous for its abundance of cheap oil and gas, the explosion of EV sales may come as a surprise, but the uptick highlights the changing market dynamics in the leading Emerging Markets (EMs) and what that tells you about the development of societies in these markets.
Car ownership index
In May 2021 bne IntelliNews launched the bne Car Ownership/Age index (bneCOA) to answer a puzzle. Estonia had more cars per head than Germany on half the income. The answer was that Estonians drove old bangers: their cars averaged 16.7 years, against 9.6 in Germany. So we divided the number of cars per 1,000 people by their average age. A country where everyone owns a 10-year-old car scores 100; one car for every two people at 10 years old scores 50.
Five years on we have updated the index with the latest data for 48 countries. We have also added a new factor. In 2021 electric vehicles (EVs) were a rounding error in most markets. In 2025 battery-electric cars took 17.4% of new car sales in the EU, 23.4% in the UK and 95.9% in Norway. We wanted to know whether the EV share of the market is, like car ownership, a proxy for how rich and developed a country is.
The short answer is that it is in Europe and it isn’t in the east. Across Europe the battery-electric share of new sales tracks income per head more closely than car ownership does. East of the EU, cheap Chinese models, used Western EVs and tax breaks have produced EV booms in poor countries such as Ukraine, Armenia and Belarus, while richer Russia and Kazakhstan barely buy any.
The updated index
The EU average score has fallen from 49.5 to 44.9. Europeans own about as many cars as they did (570 per 1,000 against 569), but they are keeping them longer. The average EU car is now 12.7 years old, up from 11.5, as high new-car prices, the cost of the switch to electric and a weak economy have made households hang on to what they have. Almost every rich Western country has slipped for the same reason.
Luxembourg is still top, but its score has dropped from 106.8 to 82.9 as its average car has aged from 6.5 to 8.2 years. Newcomer Iceland is second at 72.9, and Austria third among EU members at 62.1. The UK has fallen furthest in the top tier, from 64.4 to 51.2, as its fleet has aged from 8.2 to 10.8 years. Sweden has dropped from 52.8 to 40.0.
The accession countries are catching up. Croatia has risen from 29.0 to 38.7, Romania from 21.5 to 28.4 and Lithuania from 26.9 to 33.0, as ownership rises faster than the fleet ages. Estonia is almost unchanged at 36.2: it still has more cars per head than Germany (633 against 591), and they are still old, at 17.5 years on average. Poland’s apparent fall from 45.5 to 36.8 is mostly statistical. We now use the ACEA figure of 560 cars per 1,000 for every European country, and it is lower than the Eurostat figure of 642 used in 2021.
Further east, the Western Balkans and the South Caucasus have seen the biggest improvements. Georgia has risen from 13.8 to 20.8, North Macedonia from 12.1 to 17.5, Albania from 8.3 to 18.1 and Kosovo from 7.9 to 13.6. Part of that is real fleet growth and part is emigration, which has shrunk the populations the cars are divided by. Ukraine has risen from 11.0 to 15.5, although war-time data are poor.
Russia is the only big country in the region to have gone backwards, from 24.2 to 21.2. It has more cars than in 2021, 327 per 1,000 against 303, but its fleet has aged from 12.5 to 15.4 years since Western carmakers left in 2022. Russia now shares the third tier with Serbia, Moldova and Georgia, and has fallen further from the EU members it was about to join in 2021. Kazakhstan, new to the index, scores 14.5, level with Turkey.
The two benchmarks we have added show how the index works. China has only 230 private cars per 1,000 people, but at 7.3 years its fleet is the youngest in the sample, so it scores 31.5, level with Greece. The US, with about 850 cars and light trucks per 1,000, scores 66.4, but its figure includes pickups and SUVs registered as trucks, so it is not directly comparable.
Table 1. The bne Car Ownership/Age index, 2026
|
Country |
Rank |
Cars per 1,000 |
Average age, years |
bneCOA 2026 |
bneCOA 2021 |
Change |
BEV % of new sales 2025 |
EV-adjusted score |
|
Luxembourg |
1 |
680 |
8.2 |
82.9 |
106.8 |
-23.8 |
26.9 |
105.2 |
|
Iceland |
2 |
649 |
8.9 |
72.9 |
new |
- |
41.2 |
103.0 |
|
United States |
3 |
850 |
12.8 |
66.4 |
new |
- |
7.8 |
71.6 |
|
Austria |
4 |
571 |
9.2 |
62.1 |
68.6 |
-6.5 |
21.3 |
75.3 |
|
Germany |
5 |
591 |
10.6 |
55.8 |
59.9 |
-4.1 |
19.1 |
66.4 |
|
Italy |
6 |
701 |
13.0 |
53.9 |
57.5 |
-3.5 |
6.2 |
57.3 |
|
Switzerland |
7 |
545 |
10.5 |
51.9 |
new |
- |
22.8 |
63.7 |
|
Slovenia |
8 |
596 |
11.6 |
51.4 |
51.1 |
+0.3 |
11.2 |
57.1 |
|
United Kingdom |
9 |
553 |
10.8 |
51.2 |
64.4 |
-13.2 |
23.4 |
63.2 |
|
France |
10 |
580 |
11.5 |
50.4 |
55.9 |
-5.4 |
20.0 |
60.5 |
|
Belgium |
11 |
508 |
10.1 |
50.3 |
55.8 |
-5.5 |
34.7 |
67.8 |
|
Denmark |
12 |
479 |
9.8 |
48.9 |
51.8 |
-2.9 |
68.5 |
82.4 |
|
Ireland |
13 |
462 |
9.7 |
47.6 |
52.7 |
-5.1 |
18.9 |
56.6 |
|
Cyprus |
14 |
670 |
14.4 |
46.5 |
new |
- |
10.1 |
51.2 |
|
Norway |
15 |
514 |
11.4 |
45.1 |
new |
- |
95.9 |
88.3 |
|
EU average |
- |
570 |
12.7 |
44.9 |
49.5 |
-4.6 |
17.4 |
52.7 |
|
Netherlands |
16 |
536 |
12.1 |
44.3 |
47.0 |
-2.7 |
40.2 |
62.1 |
|
Sweden |
17 |
472 |
11.8 |
40.0 |
52.8 |
-12.8 |
36.5 |
54.6 |
|
Portugal |
18 |
561 |
14.1 |
39.8 |
39.5 |
+0.3 |
23.2 |
49.0 |
|
Croatia |
19 |
518 |
13.4 |
38.7 |
29.0 |
+9.6 |
1.8 |
39.4 |
|
Spain |
20 |
544 |
14.5 |
37.5 |
42.0 |
-4.5 |
8.8 |
40.8 |
|
Czech Republic |
21 |
609 |
16.5 |
36.9 |
37.7 |
-0.8 |
5.6 |
39.0 |
|
Poland |
22 |
560 |
15.2 |
36.8 |
45.5 |
-8.7 |
7.2 |
39.5 |
|
Malta |
23 |
587 |
16.1 |
36.5 |
new |
- |
37.9 |
50.3 |
|
Finland |
24 |
494 |
13.6 |
36.3 |
40.4 |
-4.1 |
37.2 |
49.8 |
|
Estonia |
25 |
633 |
17.5 |
36.2 |
35.9 |
+0.2 |
6.6 |
38.6 |
|
Slovakia |
26 |
503 |
14.6 |
34.5 |
31.4 |
+3.1 |
4.7 |
36.1 |
|
Lithuania |
27 |
488 |
14.8 |
33.0 |
26.9 |
+6.1 |
7.5 |
35.4 |
|
China |
28 |
230 |
7.3 |
31.5 |
new |
- |
33.2 |
42.0 |
|
Greece |
29 |
552 |
17.8 |
31.0 |
30.6 |
+0.4 |
6.2 |
32.9 |
|
Hungary |
30 |
445 |
15.6 |
28.5 |
28.9 |
-0.4 |
8.5 |
31.0 |
|
Romania |
31 |
443 |
15.6 |
28.4 |
21.5 |
+6.9 |
5.6 |
30.0 |
|
Latvia |
32 |
418 |
15.1 |
27.7 |
24.4 |
+3.3 |
7.1 |
29.6 |
|
Montenegro |
33 |
417 |
17.6 |
23.7 |
20.4 |
+3.3 |
- |
- |
|
Moldova † |
34 |
348 |
16.0 |
21.8 |
15.1 |
+6.7 |
- |
- |
|
Serbia |
35 |
378 |
17.5 |
21.6 |
19.6 |
+2.0 |
2.1 |
22.1 |
|
Russia |
36 |
327 |
15.4 |
21.2 |
24.2 |
-3.0 |
0.9 |
21.4 |
|
Georgia † |
37 |
423 |
20.3 |
20.8 |
13.8 |
+7.0 |
- |
- |
|
Belarus † |
38 |
352 |
17.5 |
20.1 |
18.3 |
+1.8 |
23.1 |
24.8 |
|
Bosnia and Herzegovina |
39 |
336 |
18.0 |
18.7 |
17.2 |
+1.5 |
- |
- |
|
Albania † |
40 |
361 |
20.0 |
18.1 |
8.3 |
+9.7 |
- |
- |
|
North Macedonia |
41 |
337 |
19.3 |
17.5 |
12.1 |
+5.3 |
- |
- |
|
Ukraine |
42 |
250 |
16.1 |
15.5 |
11.0 |
+4.5 |
28.7 |
20.0 |
|
Kazakhstan |
43 |
246 |
17.0 |
14.5 |
new |
- |
0.5 |
14.5 |
|
Turkey |
44 |
202 |
14.2 |
14.2 |
11.5 |
+2.7 |
17.5 |
16.7 |
|
Kosovo † |
45 |
259 |
19.0 |
13.6 |
7.9 |
+5.7 |
- |
- |
|
Azerbaijan † |
46 |
189 |
17.5 |
10.8 |
8.0 |
+2.8 |
2.0 |
11.0 |
|
Uzbekistan † |
47 |
119 |
17.5 |
6.8 |
4.6 |
+2.2 |
12.0 |
7.6 |
|
Tajikistan † |
48 |
58 |
17.5 |
3.3 |
2.2 |
+1.1 |
- |
- |
Sources: ACEA, Vehicles on European Roads 2026 (2024 data) for the EU, UK, Norway, Switzerland and Iceland; Autostat (Russia), Ukrainian Institute of Car Market Research, Belstat, national statistics offices and industry associations for other countries; CAAM and S&P Global Mobility for the benchmarks; ACEA, SMMT, OFV and national sources for 2025 EV shares. † No new average age published; 2021 figure carried over (for Belarus, Moldova, Azerbaijan, Uzbekistan and Tajikistan this was itself an estimate). Ukraine’s car count is estimated. US includes light trucks; China counts private cars only. Bulgaria, Armenia, Kyrgyzstan, Iran, Turkmenistan and Mongolia are excluded for lack of data.
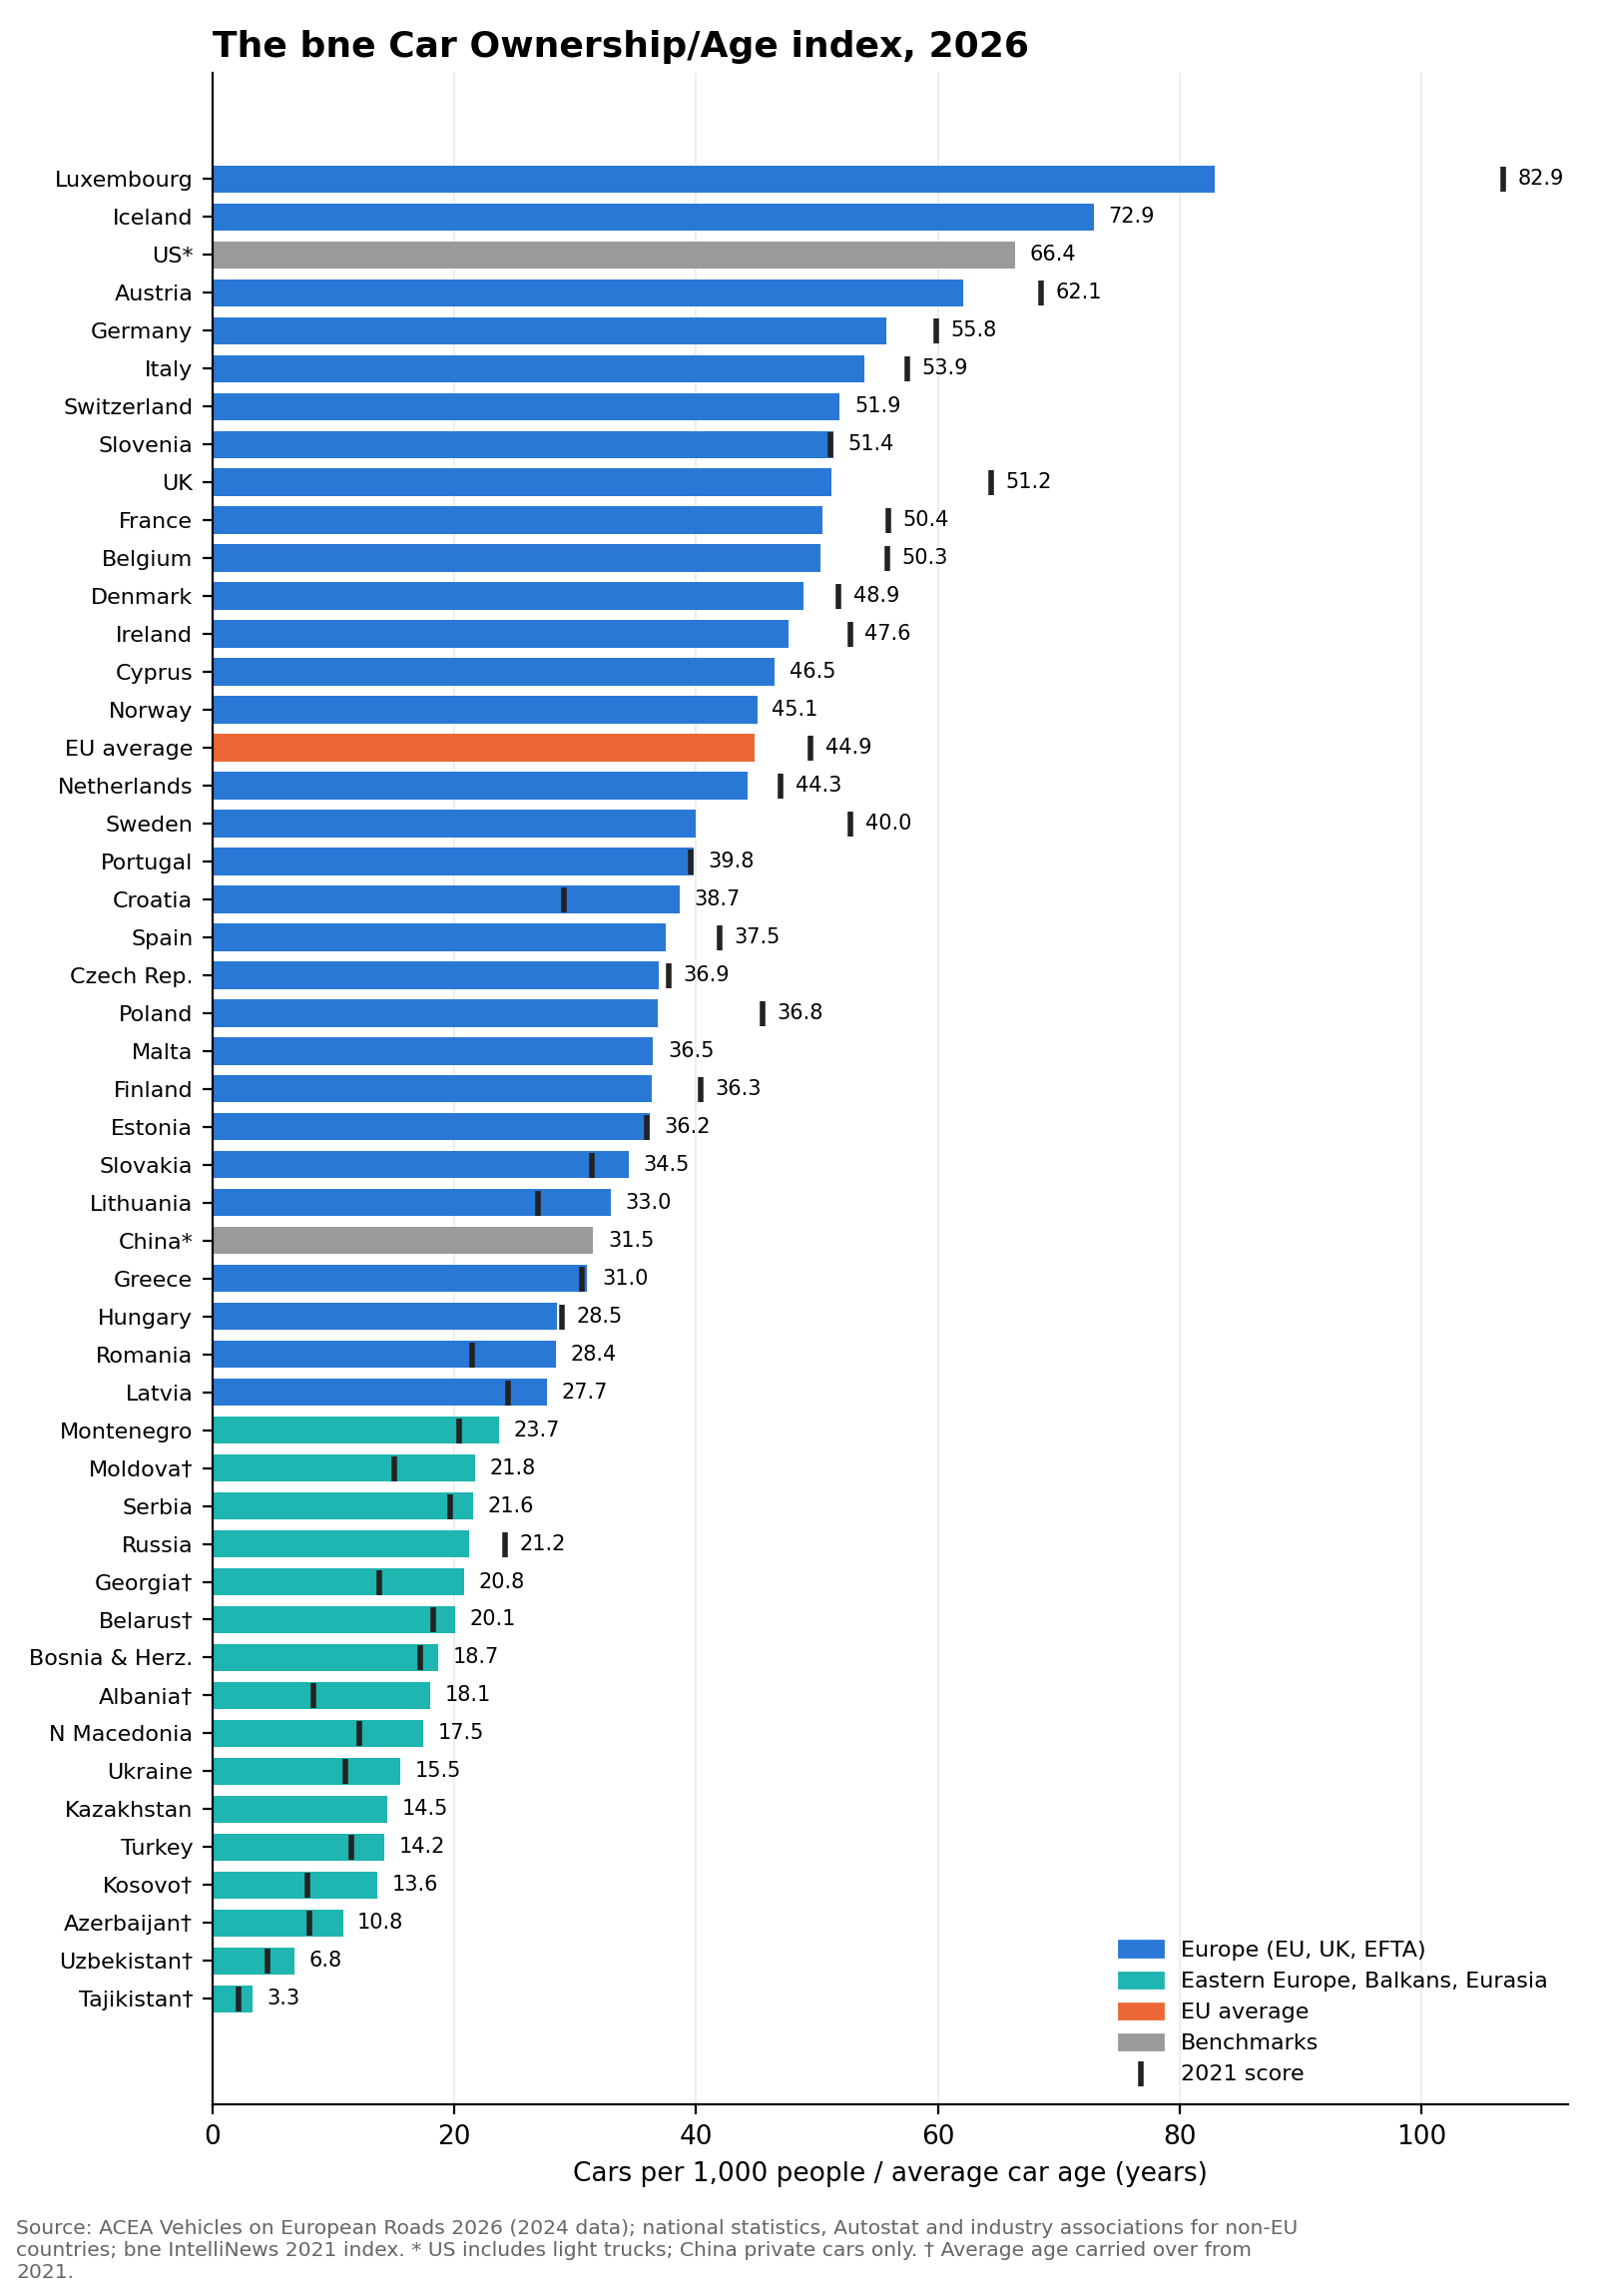
Chart 1. Most rich countries have slipped since 2021 as their fleets aged; the accession countries and the Balkans have moved up.
The tiers
As in 2021, the scores fall into four tiers. Above 50, the equivalent of one 10-year-old car for every two people, are Luxembourg, Iceland, Austria, Germany, Italy, Switzerland, Slovenia, the UK, France and Belgium. The EU core has thinned out: in 2021 Sweden, Ireland and Denmark also made the cut.
Between 25 and 50 sit the rest of the EU, from Denmark (48.9) and Norway (45.1) down to Latvia (27.7), with China in their midst. Between 10 and 25 are the Western Balkans, Russia, Belarus, Moldova, Georgia, Ukraine, Kazakhstan, Turkey and Azerbaijan. Below 10, fewer than one 10-year-old car for every 10 people, are only Uzbekistan (6.8) and Tajikistan (3.3). Both have improved, Uzbekistan from 4.6 thanks to its growing car industry.
The new factor: electric cars
The EV revolution has been very uneven. Norway, where battery-electric cars took 95.9% of new sales in 2025, has almost finished the switch. Denmark is at 68.5%. Iceland, the Netherlands, Malta, Finland, Sweden and Belgium are all between 34% and 42%. At the other end of the EU, battery-electric cars made up 6.2% of sales in Italy, 5.6% in the Czech Republic and 1.8% in Croatia.
Across Europe the EV share is strongly linked to income. Leaving out Luxembourg and Ireland, whose GDP is inflated by multinationals, the correlation between the battery-electric share of new sales and GDP per head at PPP is 0.82 across 29 European countries. That is as strong as the link between our car index and income (0.84 across all countries). Rich northern countries with generous subsidies and cheap clean power buy EVs; poorer southern and eastern ones buy petrol cars and used diesels from Germany. On the stock of cars the picture is the same: battery-electric cars make up 27.7% of Norway’s fleet, 12.1% of Denmark’s and Iceland’s, but 2.3% of the EU’s and less than 1% in Poland, Spain, Greece and most of Central Europe.
East of the EU the link breaks down completely, and even reverses: the correlation for the 11 countries with data is -0.35. Ukraine, one of the poorest countries in Europe, now has one of the highest EV shares on the continent: 28.7% of new cars and 31% of used imports in 2025 were battery-electric, helped by tax breaks on imported EVs. Armenia (27% in January-August) and Belarus (23.1%) have been flooded with cheap Chinese EVs and re-exported cars. Electric cars made up 71% of Uzbekistan’s car imports, helped by BYD’s new local plant, although less than an eighth of total sales. Turkey’s 17.5% has been helped by the home-grown Togg.
Meanwhile Russia, richer per head at PPP than any of them, bought only 12,500 new battery-electric cars in 2025, 0.9% of the market, as sanctions, a high recycling levy on imports and a market dominated by cheap Chinese petrol cars kept EVs out. Kazakhstan is at about 0.5%, Serbia 2.1% and Azerbaijan 2.0%. In the east, the EV share measures trade and tax policy and the reach of Chinese exporters rather than wealth.
China, the benchmark, is in a league of its own. Battery-electric cars took 33.2% of its new car sales in 2025, and with plug-in hybrids and range-extenders new-energy vehicles made up more than half. EVs there are a mass-market product, sold at prices that compete with petrol cars. The US, with 7.8%, is well below the EU.
Table 2. Electric car share of new sales, 2025
|
Country |
Battery-electric, % of new sales |
Plug-in hybrid, % |
BEV share of fleet, % (2024) |
GDP per head PPP 2025, $ |
|
Norway |
95.9 |
1.5 |
27.7 |
111,545 |
|
Denmark |
68.5 |
2.5 |
12.1 |
86,094 |
|
Iceland |
41.2 |
20.2 |
12.1 |
80,662 |
|
Netherlands |
40.2 |
18.9 |
6.1 |
84,738 |
|
Malta |
37.9 |
6.5 |
2.2 |
78,689 |
|
Finland |
37.2 |
20.2 |
4.3 |
66,297 |
|
Sweden |
36.5 |
26.7 |
7.2 |
74,081 |
|
Belgium |
34.7 |
9.5 |
5.1 |
76,208 |
|
China |
33.2 |
19.3 |
- |
29,352 |
|
Ukraine |
28.7 |
- |
- |
20,904 |
|
Armenia |
27.0 |
- |
- |
24,871 |
|
Luxembourg |
26.9 |
7.9 |
7.1 |
152,966 |
|
United Kingdom |
23.4 |
11.1 |
3.8 |
65,525 |
|
Portugal |
23.2 |
15.2 |
2.6 |
50,269 |
|
Belarus |
23.1 |
- |
- |
34,035 |
|
Switzerland |
22.8 |
11.2 |
4.4 |
102,096 |
|
Austria |
21.3 |
10.1 |
3.8 |
75,825 |
|
France |
20.0 |
6.7 |
2.8 |
66,276 |
|
Germany |
19.1 |
10.9 |
3.3 |
74,004 |
|
Ireland |
18.9 |
15.2 |
3.1 |
152,632 |
|
Turkey |
17.5 |
0.2 |
- |
43,786 |
|
Uzbekistan |
12.0 |
3.0 |
- |
12,559 |
|
Slovenia |
11.2 |
3.4 |
1.3 |
57,922 |
|
Cyprus |
10.1 |
5.3 |
0.5 |
64,785 |
|
Spain |
8.8 |
10.8 |
0.8 |
57,034 |
|
Hungary |
8.5 |
5.5 |
1.4 |
48,239 |
|
United States |
7.8 |
1.7 |
- |
89,599 |
|
Lithuania |
7.5 |
10.6 |
1.1 |
57,818 |
|
Poland |
7.2 |
5.7 |
0.4 |
55,793 |
|
Latvia |
7.1 |
12.2 |
1.2 |
43,509 |
|
Estonia |
6.6 |
10.7 |
0.9 |
49,492 |
|
Greece |
6.2 |
8.1 |
0.2 |
44,981 |
|
Italy |
6.2 |
6.4 |
0.7 |
63,538 |
|
Czech Republic |
5.6 |
4.4 |
0.5 |
60,247 |
|
Romania |
5.6 |
- |
0.4 |
48,724 |
|
Bulgaria |
4.9 |
1.1 |
0.6 |
42,816 |
|
Slovakia |
4.7 |
4.4 |
0.5 |
47,684 |
|
Serbia |
2.1 |
- |
- |
32,742 |
|
Azerbaijan |
2.0 |
- |
- |
25,795 |
|
Croatia |
1.8 |
3.6 |
0.5 |
51,593 |
|
Russia |
0.9 |
- |
- |
49,049 |
|
Kazakhstan |
0.5 |
1.5 |
- |
44,778 |
|
EU average |
17.4 |
9.4 |
2.3 |
- |
Sources: ACEA full-year 2025 registrations and Vehicles on European Roads 2026; SMMT; OFV; Autostat; Ukrainian Institute of Car Market Research (new cars; 31% of used imports); Belstat; Armenia Jan-Aug 2025 registrations; Uzbekistan estimate (71.2% of imports); Azerbaijan share of imports Jan-Sep; ODMD (Turkey); CAAM (China, PHEV includes range-extenders); Cox Automotive (US); IMF World Economic Outlook.
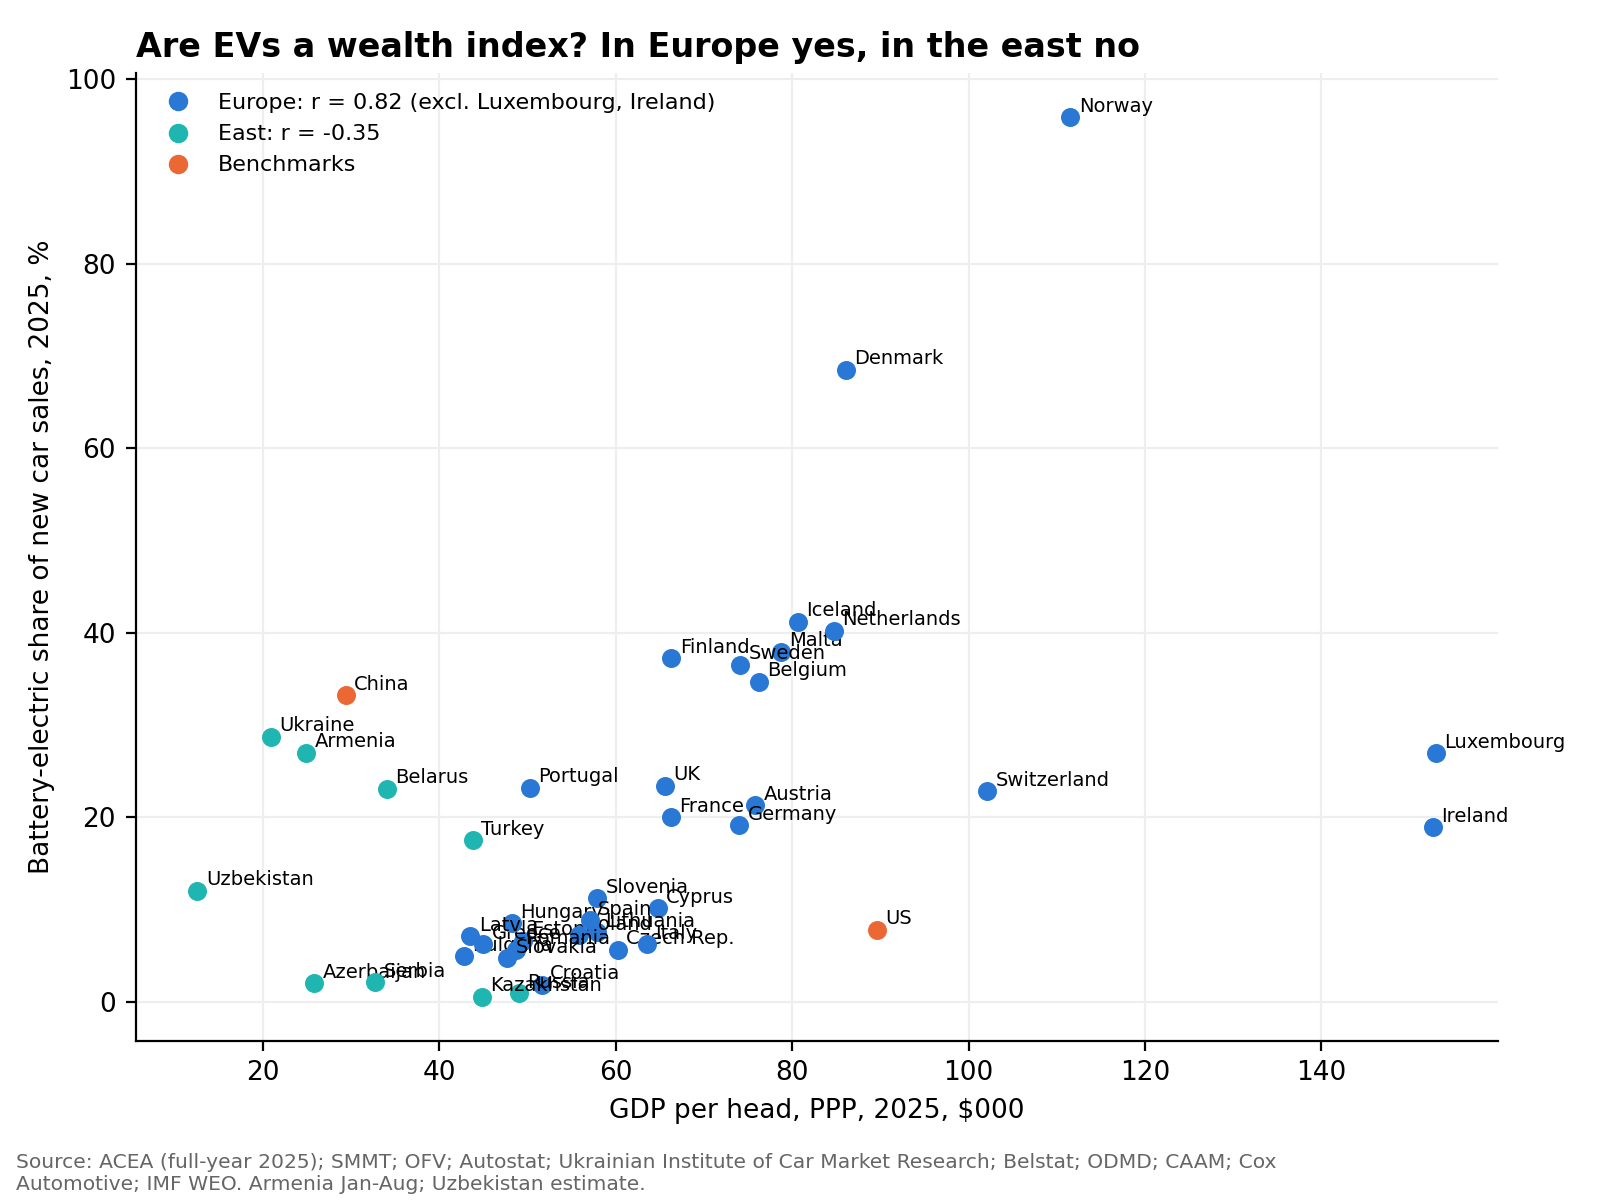
Chart 2. In Europe the EV share rises with income; in the former Soviet Union and Turkey it depends on tax breaks and Chinese imports.
An EV-adjusted index
To fold the new factor into the index we have kept the formula simple, as before. The EV-adjusted score multiplies the classic score by one plus the battery-electric share of new sales. A country where half of new cars are electric gets a 50% bonus; one with no EVs is unchanged.
The adjustment reshuffles the top of the table. Norway jumps from 15th to third, with a score of 88.3, and Denmark from 12th to fourth with 82.4. Luxembourg (105.2) and Iceland (103.0) both break through 100. Italy, with lots of cars but few EVs, drops from sixth to 13th. Further down, Belarus overtakes Serbia and Russia, and Ukraine closes most of the gap with Russia (20.0 against 21.4). China rises from 31.5 to 42.0, ahead of Spain, Poland and the whole of Central Europe.
The EV-adjusted score is best read alongside the classic one. In Western Europe the two agree about who is rich and simply add a measure of who is greening fastest. In the east a high EV score says more about a country’s border with China and its import rules than about its middle class. As in 2021, the bneCOA remains a pretty good proxy for how far countries have come. Five years on, the uncomfortable finding is that in much of rich Europe that progress has stalled as fleets age.
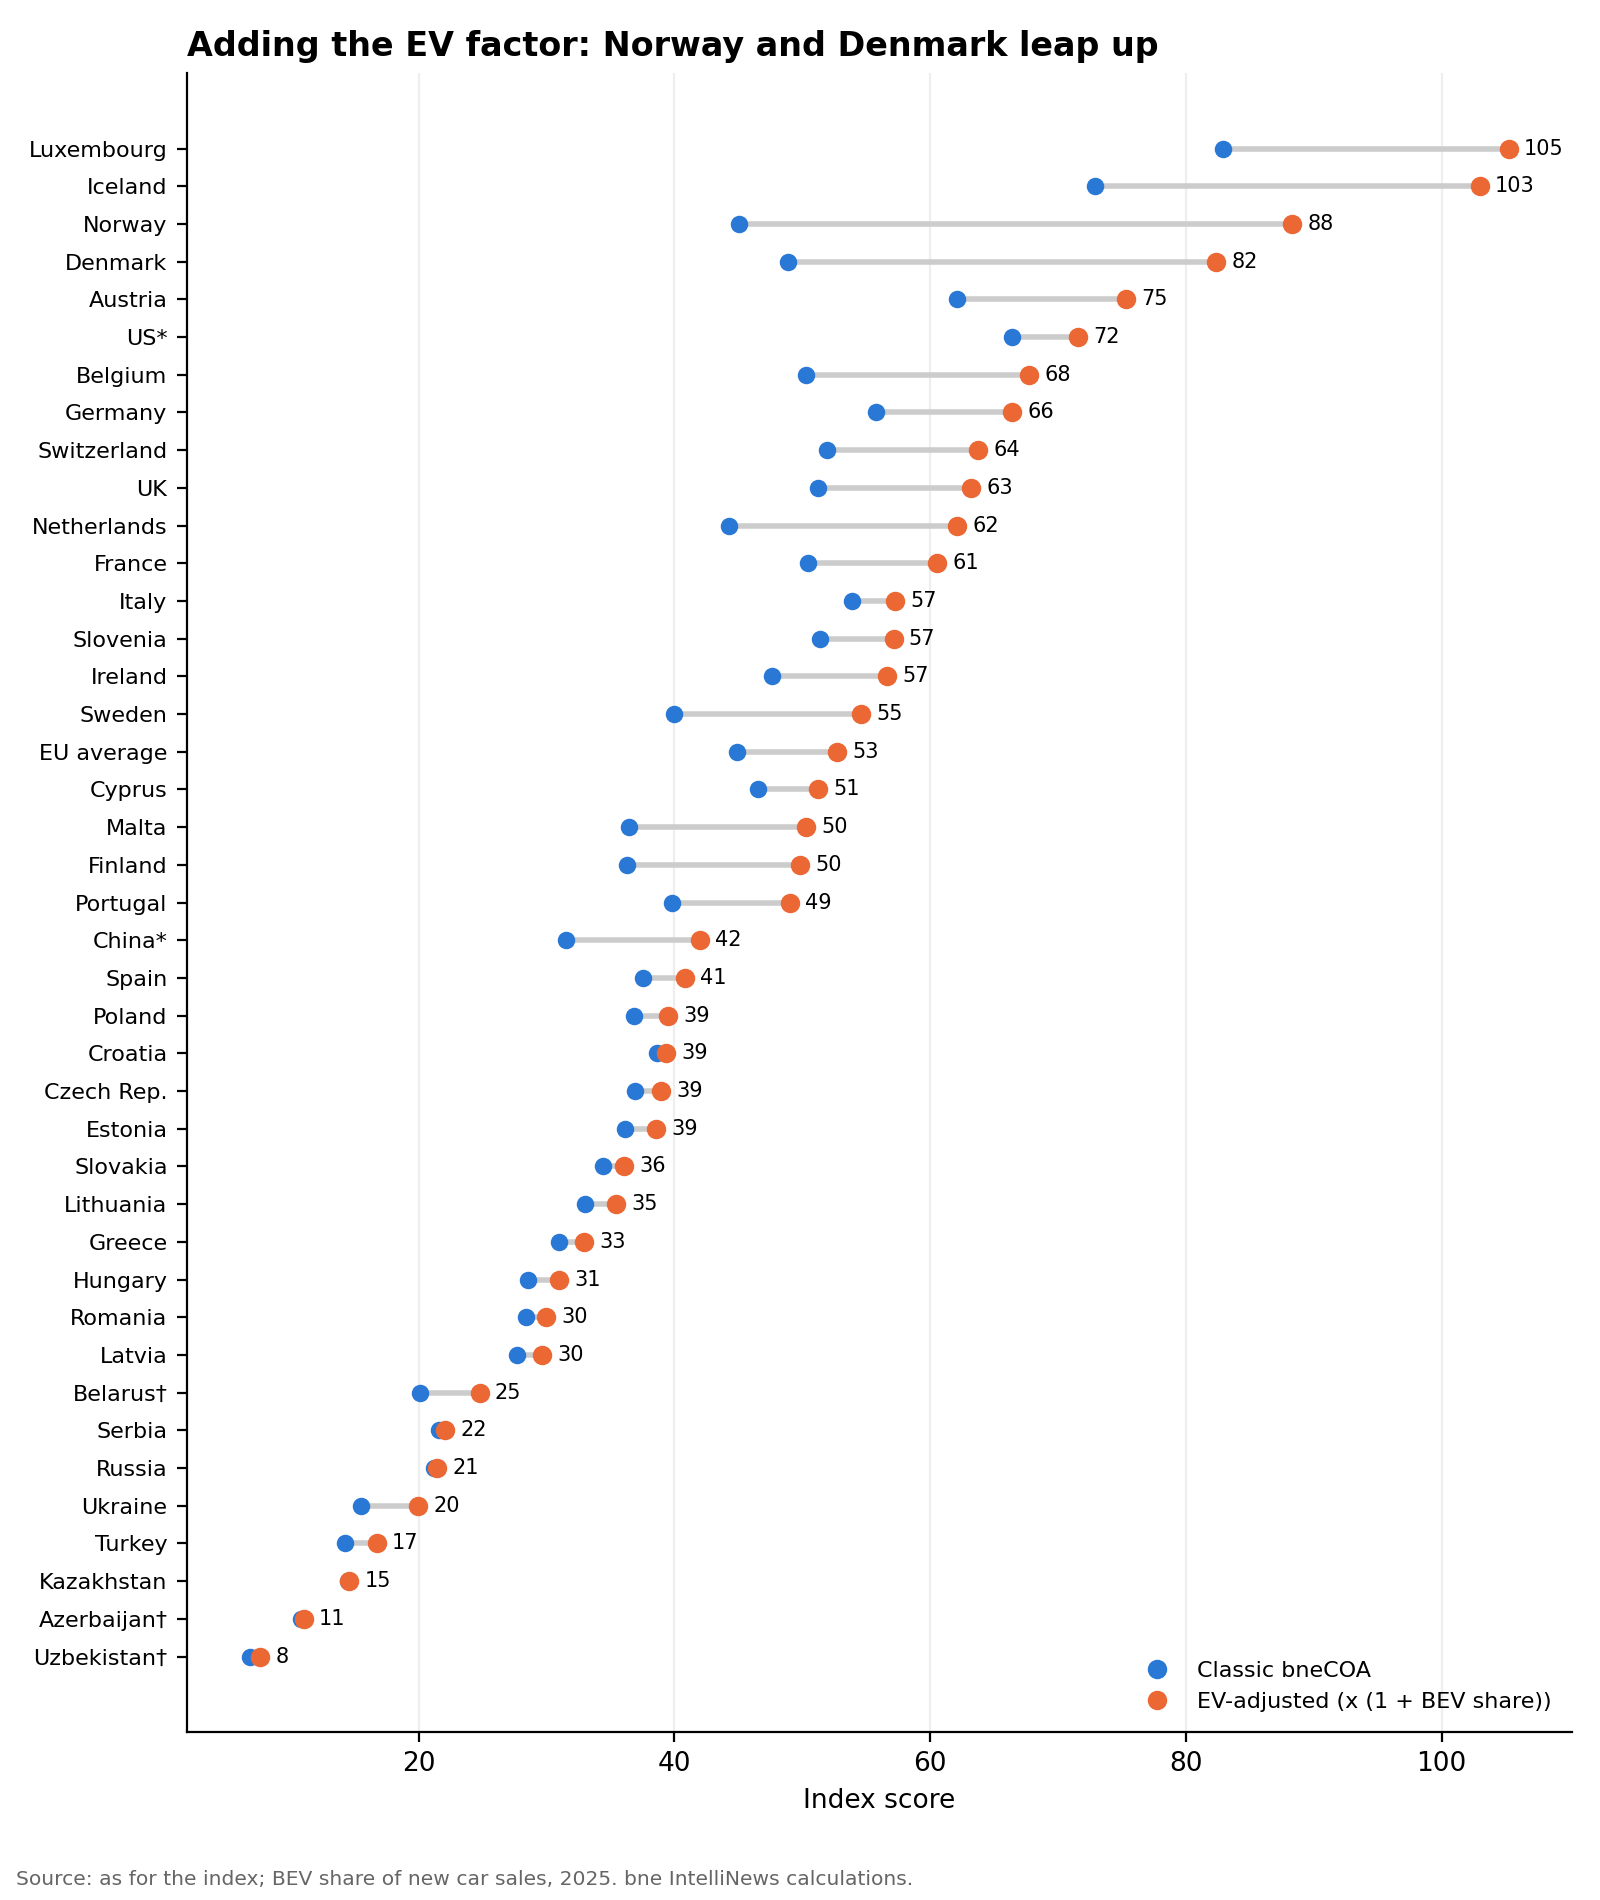
Chart 3. The EV adjustment lifts the Nordic countries, the Netherlands and China and leaves Russia and Kazakhstan where they were.
Unlock premium news, Start your free trial today.


